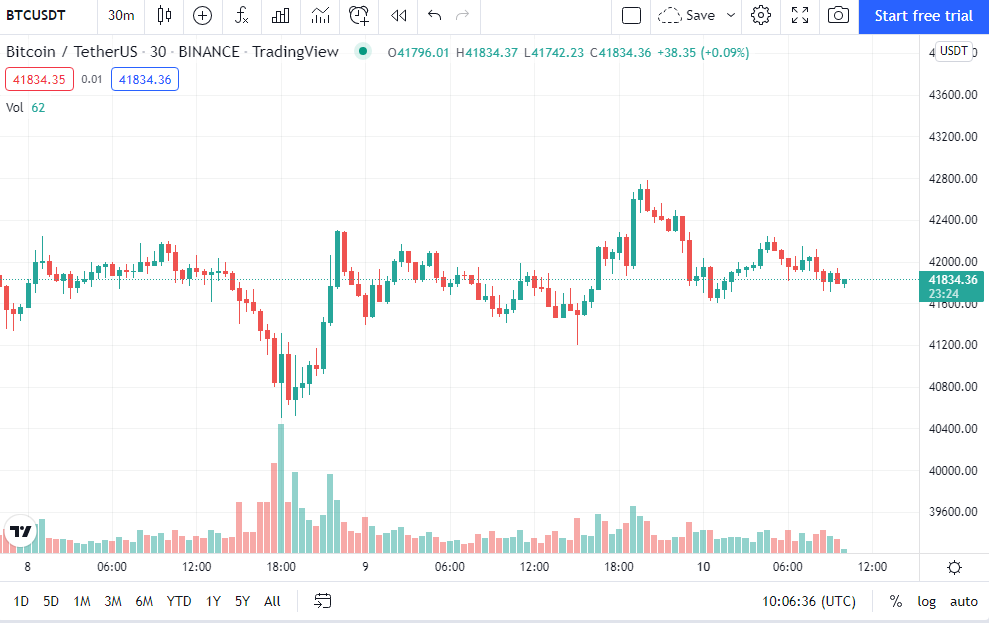
- The BTC price is already at a three-month low.
- The daily chart of Ethereum price levels showed a falling wedge shape.
The Bitcoin price rebounded on Sunday, January 9, ending a six-day sideways trend. At press time, Bitcoin was trading at $41,898, with a $792 billion market value. On-chain data and RSI levels have been suggesting a trend reversal. The US Inflation Data due on Wednesday will be a significant factor to monitor. The CPI report will eventually determine whether the Fed will increase quantitative tightening (QT), affecting market liquidity and pushing up bitcoin prices.
The BTC price is already at a three-month low, and any further decline might be catastrophic. The Bitcoin RSI has been at its lowest levels, perhaps indicating oversold conditions. The Bitcoin RSI has dropped to its lowest level in two years. This level was last observed in March 2020 and May 2021. However, bitcoin has started to bounce back and has gained 0.82 over the last 24 hours.

Read More: Bitcoin Price Prediction
Ethereum (ETH)
The daily chart of Ethereum price levels showed a falling wedge shape. By breaking the support trendline and $3600 horizontal barrier on January 5, crypto traders got a short opportunity.
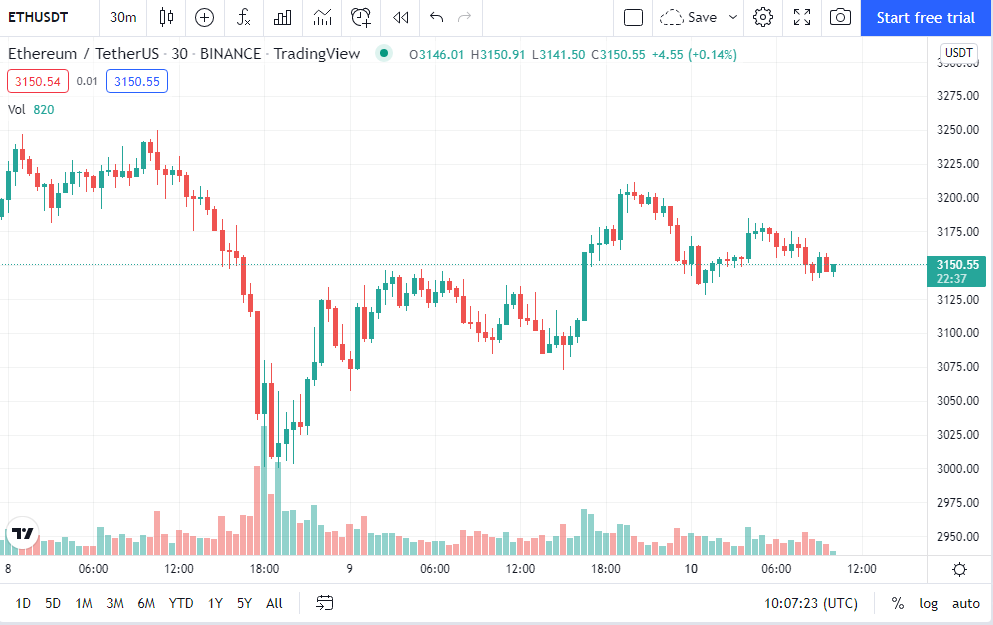
The crypto market crash intensified selling pressure, dropping the ETH price to $3000. The chart showed four consecutive red candles, indicating a 20% drop in one week. The daily RSI of 27 has suddenly entered the overbought area, suggesting the strength of selling pressure.

The customary pivot mark for Ethereum coin price is $3100, followed by $3570. On the other hand, support is at $3000 and $2750. According to CoinMarketCap, the Ethereum price today is $3,148.69 USD with a 24-hour trading volume of $12,083,363,125 USD. However, Ethereum has been up 1.13% in the last 24 hours.
Read more: Ethereum Price Prediction


