
- Uniswap is hovering near $10 after a rally of over 19%.
- UNI’s daily trading volume has surged by more than 66%.
The 2.06% surge has pushed the crypto market cap to $3.9 trillion, with the overall greed sentiment as the Fear and Greed Index value at 71. The largest assets, like Bitcoin and Ethereum, have set a green momentum, trading at $119.2K and $3.6K. Following suit, Uniswap (UNI) has rallied by over 19.77%.
Notably, the asset opened the day trading at a low range of $8.67. Gradually, with the bullish command in the Uniswap market, the price has broken through the vital resistance between $8.72 and $10.81 zones before ascending to a high of $10.86, as per CoinMarketCap data.
At the time of writing, Uniswap trades within the $10.63 range, with its market cap reaching $6.69 billion. Meanwhile, the daily trading volume has increased by over 66.33%, reaching $1.67 billion. Moreover, the market has observed the liquidation of $5.76 million worth of Uniswap during this period, according to Coinglass.
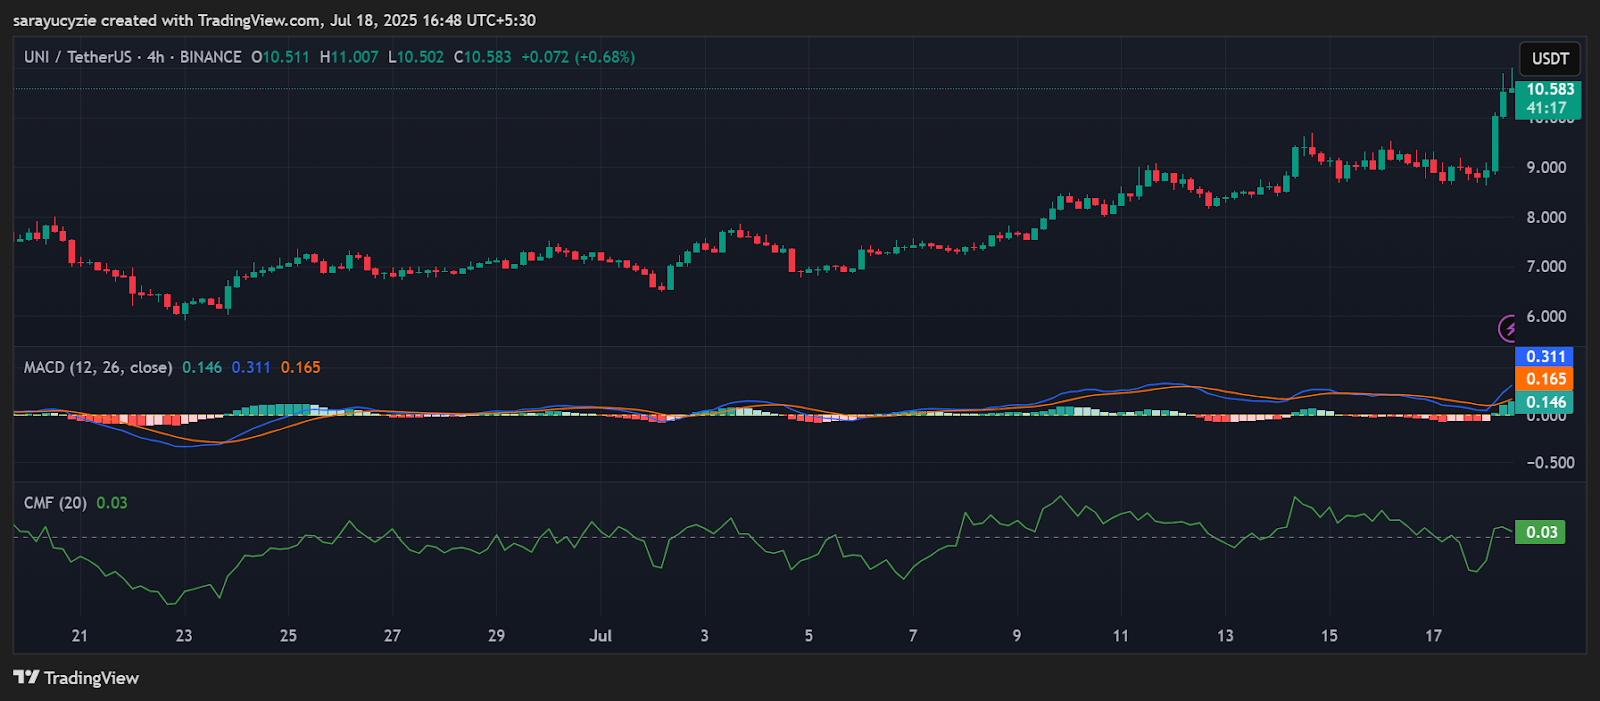
Is Uniswap Gearing Up for a Breakout Run?
The Moving Average Convergence Divergence (MACD) line of Uniswap is positioned above the signal line. This indicates the upside momentum is building and gives a sign of a potential continuation of the current rally. In addition, UNI’s Chaikin Money Flow (CMF) indicator is resting at 0.03, generally suggesting that the capital is flowing into the asset and there is a mild buying pressure within the market.
Assuming the UNI bulls are gaining more strength, the price might climb and test the $10.69 resistance. With the prolonged bullish correction, the price could trigger the golden cross formation and send the Uniswap price to a high above $10.78.
If the active uptrend of the asset reverses, the UNI price could instantly slip to the support at the $10.57 range. An extended bearish correction might push the death cross emergence, likely driving the Uniswap price toward $10.48 even lower.
Uniswap’s Bull Bear Power (BBP) value at 2.526 signals a strong bullish dominance in the market, increasing the possibility of upward price movement. Furthermore, the asset is in the overbought zone, with the daily Relative Strength Index (RSI) found at 74.41. Also, the strong buying may be resulting in a pullback or consolidation.