
- Bullish CHZ price prediction for 2026 is $0.05019 to $0.09861.
- Chiliz (CHZ) price might reach $0.5 soon.
- Bearish CHZ price prediction for 2026 is $0.01541.
In this Chiliz (CHZ) price prediction 2026, 2027-2030, we will analyze the price patterns of CHZ by using accurate trader-friendly technical analysis indicators and predict the future movement of the cryptocurrency.
TABLE OF CONTENTS |
INTRODUCTION |
|
CHILIZ (CHZ) PRICE PREDICTION 2026 |
|
| CHILIZ (CHZ) PRICE PREDICTION 2027, 2028-2030 |
| CONCLUSION |
| FAQ |
Chiliz (CHZ) Current Market Status
| Current Price | $0.04339 | 24 – Hour Price Change | 2.25% Up |
| 24 – Hour Trading Volume | $68.62M |
| Market Cap | $449.53M |
| Circulating Supply | 10.36B CHZ | All – Time High | $0.8915 (On March 13, 2021) |
| All – Time Low | $0.004001 (On September 28, 2019) |
What is Chiliz (CHZ)
| TICKER | CHZ |
| BLOCKCHAIN | Ethereum |
| CATEGORY | ERC-20 token |
| LAUNCHED ON | October 2018 |
| UTILITIES | Governance, tipping system, gas fees & rewards |
Chiliz (CHZ) is a cryptocurrency designed for sports and entertainment platforms, specifically enabling fans to participate in the decision-making processes of their favorite sports teams. Powered by the Socios.com platform, Chiliz allows fans to purchase branded Fan Tokens from a variety of sports teams and organizations. These tokens enable fans to vote on team decisions, earn rewards, and gain access to exclusive promotions. Founded in 2018 by Alexandre Dreyfus, Chiliz aims to bridge the gap between sports entities and their global fanbases through blockchain technology, creating a more interactive and engaging fan experience.
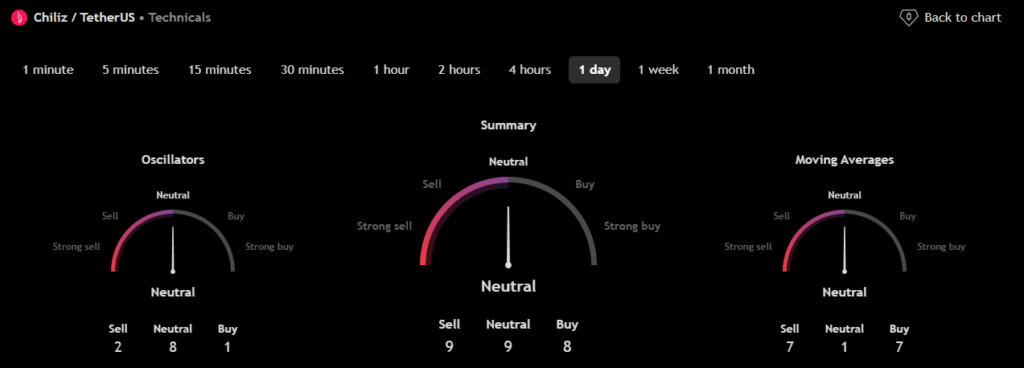
Chiliz 24H Technicals
Chiliz (CHZ) Price Prediction 2026
Chiliz (CHZ) ranks 93rd on CoinMarketCap in terms of its market capitalization. The overview of the Chiliz price prediction for 2026 is explained below with a daily time frame.
In the above chart, Chiliz (CHZ) laid out a Rounding Bottom pattern. The price movements form a pattern that resembles a bow and hence is also known as the saucer bottom pattern. In general, the rounding bottom pattern indicates a long-term price reversal. This pattern also highlights the shift in market sentiment, as the trend appears to transition from bearish to bullish.
Investors generally have to stay cautious and time the market well. If the price breaks and moves past the resistance level, it will enter a confirmed bullish trajectory.
At the time of analysis, the price of Chiliz (CHZ) was recorded at $0.04339 . If the pattern trend continues, then the price of CHZ might reach the resistance levels of $0.05098 and $0.07869. If the trend reverses, then the price of CHZ may fall to the support of $0.03677 and $0.3108.
Chiliz (CHZ) Resistance and Support Levels
The chart given below elucidates the possible resistance and support levels of Chiliz (CHZ) in 2026.
From the above chart, we can analyze and identify the following as resistance and support levels of Chiliz (CHZ) for 2026.
| Resistance Level 1 | $0.05019 |
| Resistance Level 2 | $0.09861 |
| Support Level 1 | $0.02697 |
| Support Level 2 | $0.01541 |
CHZ Resistance & Support Levels
Chiliz (CHZ) Price Prediction 2026 — RVOL, MA, and RSI
The technical analysis indicators such as Relative Volume (RVOL), Moving Average (MA), and Relative Strength Index (RSI) of Chiliz (CHZ) are shown in the chart below.
From the readings on the chart above, we can make the following inferences regarding the current Chiliz (CHZ) market in 2026.
| INDICATOR | PURPOSE | READING | INFERENCE |
| 50-Day Moving Average (50MA) | Nature of the current trend by comparing the average price over 50 days | 50 MA = $0.03860Price = $0.04614 (50MA < Price) | Bullish/Uptrend |
| Relative Strength Index (RSI) | Magnitude of price change;Analyzing oversold & overbought conditions | 64.47323 <30 = Oversold 50-70 = Neutral>70 = Overbought | Neutral |
| Relative Volume (RVOL) | Asset’s trading volume in relation to its recent average volumes | Below cutoff line | Weak volume |
Chiliz (CHZ) Price Prediction 2026 — ADX, RVI
In the below chart, we analyze the strength and volatility of Chiliz (CHZ) using the following technical analysis indicators — Average Directional Index (ADX) and Relative Volatility Index (RVI).
From the readings on the chart above, we can make the following inferences regarding the price momentum of Chiliz (CHZ).
| INDICATOR | PURPOSE | READING | INFERENCE |
| Average Directional Index (ADX) | Strength of the trend momentum | 17.01535 | Weak Trend |
| Relative Volatility Index (RVI) | Volatility over a specific period | 47.16 <50 = Low >50 = High | High volatility |
Comparison of CHZ with BTC, ETH
Let us now compare the price movements of Chiliz (CHZ) with that of Bitcoin (BTC), and Ethereum (ETH).
From the above chart, the price action of CHZ is similar to that of BTC and ETH. That is, when the prices of BTC and ETH increase or decrease, the price of CHZ increases or decreases accordingly.
Chiliz (CHZ) Price Prediction 2027, 2028 – 2030
With the help of the aforementioned technical analysis indicators and trend patterns, let us predict the price of Chiliz (CHZ) between 2027, 2028, 2029, and 2030.
| Year | Bullish Price | Bearish Price |
| Chiliz (CHZ) Price Prediction 2027 | $1 | $0.01 |
| Chiliz (CHZ) Price Prediction 2028 | $2.5 | $0.009 |
| Chiliz (CHZ) Price Prediction 2029 | $4 | $0.008 |
| Chiliz (CHZ) Price Prediction 2030 | $5.5 | $0.007 |
Conclusion
If Chiliz (CHZ) establishes itself as a good investment in 2026, this year would be favorable to the cryptocurrency. In conclusion, the bullish Chiliz (CHZ) price prediction for 2026 is $0.09861. Comparatively, if unfavorable sentiment is triggered, the bearish Chiliz (CHZ) price prediction for 2026 is $0.01541.
If the market momentum and investors’ sentiment positively elevate, then Chiliz (CHZ) might hit $0.5. Furthermore, with future upgrades and advancements in the Chiliz ecosystem, CHZ might surpass its current all-time high (ATH) of $0.8915 and mark its new ATH.
FAQ
1. What is Chiliz (CHZ)?
Chiliz (CHZ) is a cryptocurrency designed for sports and entertainment platforms, specifically enabling fans to participate in the decision-making processes of their favorite sports teams.
2. Where can you purchase Chiliz (CHZ)?
Traders can trade Chiliz (CHZ) on the following cryptocurrency exchanges such as Binance, Bybit, OKX, DigiFinex, and BingX.
3. Will Chiliz (CHZ) reach a new ATH soon?
With the ongoing developments and upgrades within the Chiliz platform, Chiliz (CHZ) has a high possibility of reaching its ATH soon.
4. What is the current all-time high (ATH) of Chiliz (CHZ)?
Chiliz (CHZ) hit its current all-time high (ATH) of $0.8915 on March 13, 2021.
5. What is the lowest price of Chiliz (CHZ)?
According to CoinMarketCap, CHZ hit its all-time low (ATL) of $0.004001 on September 28, 2019.
6. Will Chiliz (CHZ) reach $0.5?
If Chiliz (CHZ) becomes one of the active cryptocurrencies that majorly maintain a bullish trend, it might rally to hit $0.5 soon.
7. What will be Chiliz (CHZ) price by 2027?
Chiliz (CHZ) price is expected to reach $1 by 2027.
8. What will be Chiliz (CHZ) price by 2028?
Chiliz (CHZ) price is expected to reach $2.5 by 2028.
9. What will be Chiliz (CHZ) price by 2029?
Chiliz (CHZ) price is expected to reach $4 by 2029.
10. What will be Chiliz (CHZ) price by 2030?
Chiliz (CHZ) price is expected to reach $5.5 by 2030.
Top Crypto Predictions
Chainlink (LINK) Price Prediction
Router Protocol (ROUTE) Price Prediction
Hedera (HBAR) Price Prediction
Disclaimer: The opinion expressed in this chart is solely the author’s. It does not represent any investment advice. TheNewsCrypto team encourages all to do their own research before investing.