In Theta (THETA) Technical Analysis 2021, we use past statistics, price patterns, RSI, and much other information about THETA to analyze the future movement of the cryptocurrency.
Theta (THETA) is a blockchain-related network developed for video streaming. Started in March 2019, the Theta mainnet works as a decentralized network in which the bandwidth and computing resources are shared by users on a peer-to-peer (P2P) basis. THETA is its own native cryptocurrency token. More so, it performs various governance tasks within the network.
Theta (THETA) Current Market Status
According to CoinGecko, the Theta price is trading at $7.87 with a 24-hour trading volume of $409,502,647, at the time of writing. However, THETA has increased by 5.2% in the last 24 hours.
Moreover, THETA has a circulating supply of 1,000,000,000 THETA and a maximum supply of 1,000,000,000. Currently, THETA trades in Binance, Huobi Global, OKEx, FTX, and Upbit.
Theta Technical Analysis 2021
The recent development and upgrades might push Theta (THETA) to reach new heights. Now, let’s deep dive into the Theta technical analysis 2021. The weekly time frame chart with two views of the pattern of Theta (THETA) is shown below.
View 1:
The view 1 chart of THETA shows the Bullish flag pattern.
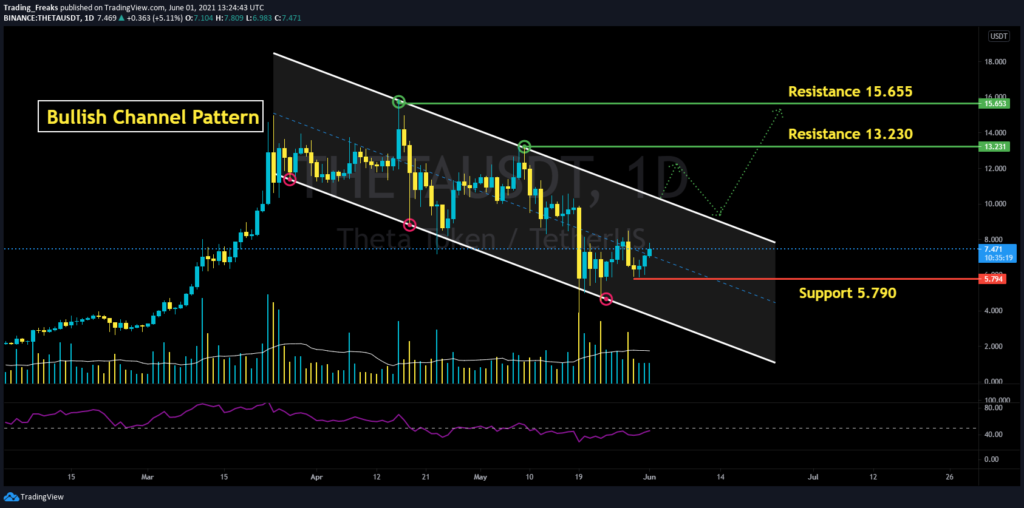
A bullish channel is a continuation chart pattern. A bullish channel is created by two parallel bullish lines. Moreover, the price progresses between these two parallel trend lines. More so, the upper trend line is called the resistance line and the lower trend line is called the support line.
View 2:
The view 2 chart of THETA shows Falling Wedge pattern
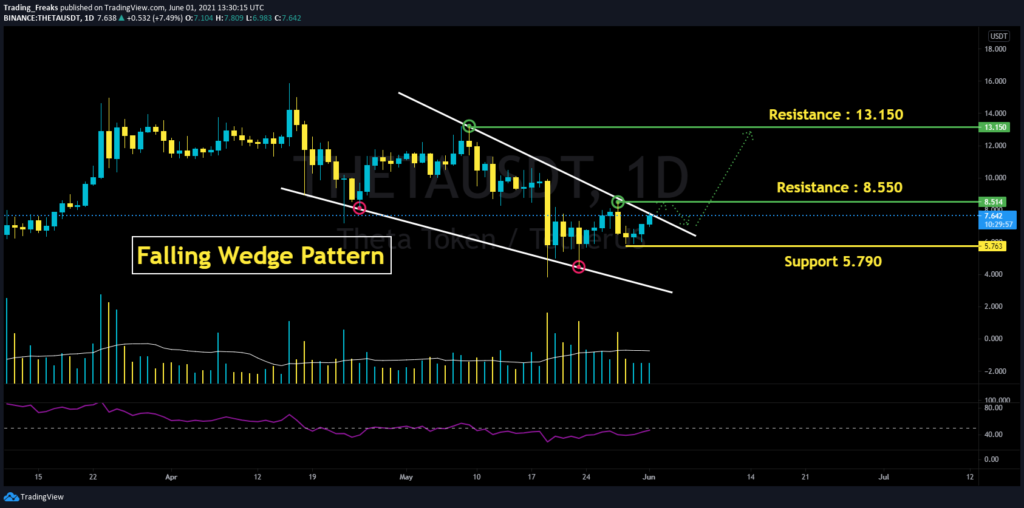
The above chart shows the Falling Wedge Pattern of THETA. Moreover, the Falling Wedge is a bullish pattern that starts wide at the top and contracts as prices move lower. However, this price action forms a cone that goes down as the reaction highs and reaction lows converge.
Notably, both the patterns indicate bullish signals. This shows the THETA price will surge even higher over taking its all-time high price in the near future.
Theta (THETA) RSI, MACD, and MA
The below chart shows the Moving Average Convergence/Divergence (MACD) of THETA. Notably, the MACD (blue) made a crossover and stayed just above the signal indicator (orange line). This means that cryptocurrency traders can still expect more bullish days ahead.
In contrast, if the MACD begins to move below the signal indicator and performs a bearish crossover. Then the crypto has a high possibility of reaching new lows.
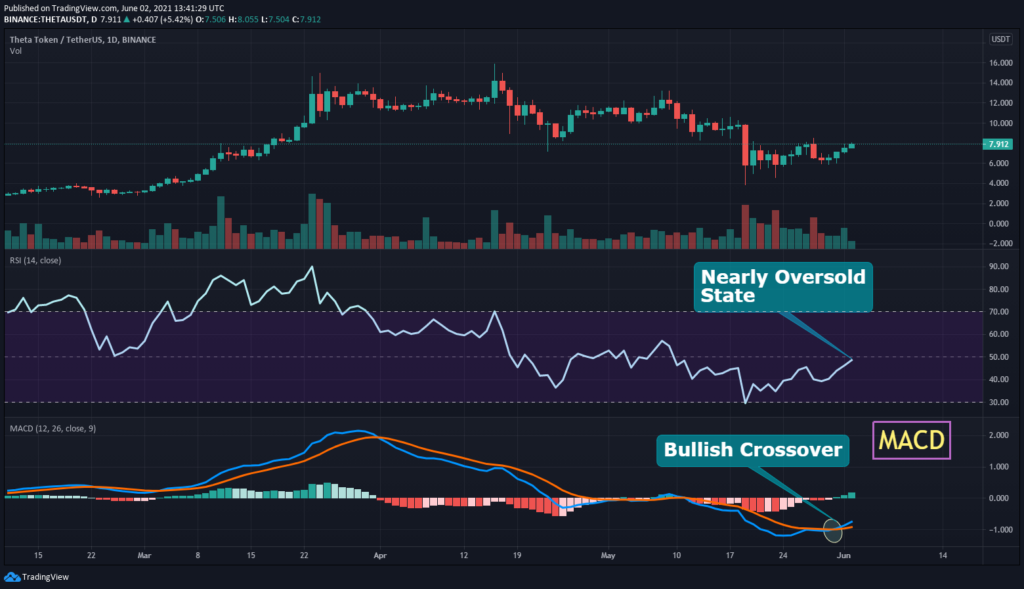
Now let’s look at the relative strength index (RSI) of THETA. As shown in the chart above, the RSI remains at level 48. This shows that THETA’s price is in a nearly oversold state. However, this gives confidence for the traders to trade without any fear.
Theta’s Moving Average (MA) and Exponential Moving Average (EMA) is shown in the chart below. Moreover, MA is a part of technical analysis that helps traders to recognize trends. While EMA is a type of moving average.
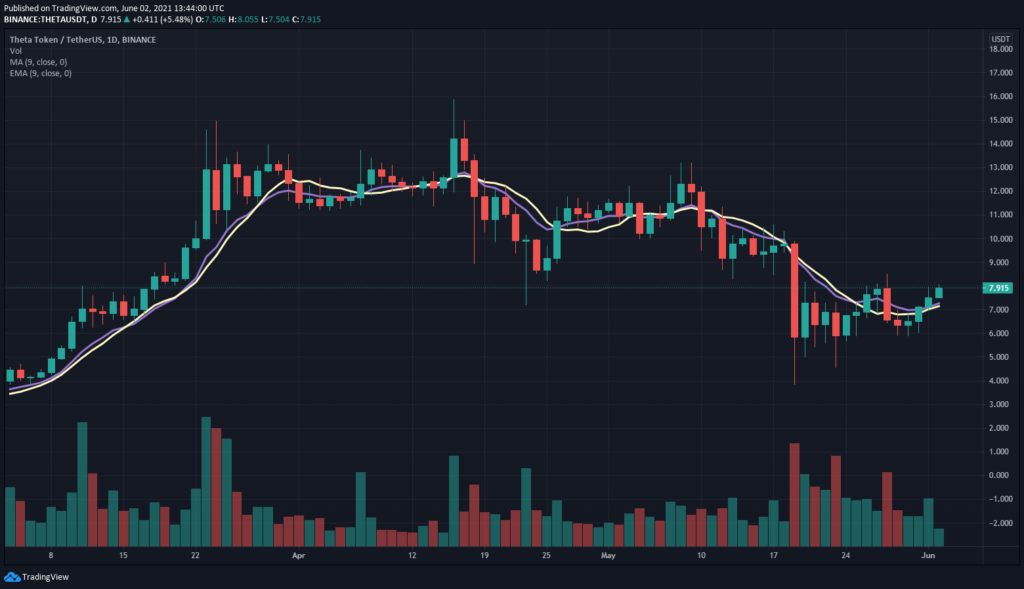
From the beginning of 2021, it is clear that the THETA price has shown many bullish patterns. Furthermore, taking all these into account, THETA could have a competitive market in 2021.
Conclusion
With the ongoing developments and upgrades that are taking place within the THETA platform. The cryptocurrency THETA has a fantastic future ahead in this crypto market. However, it is possible to see THETA reaching new heights.
Bullish THETA price prediction 2021 is $15. As said above, it may reach great heights, however reaching $50 if investors have decided that THETA is a good investment in 2021.
FAQ
THETA is listed on many crypto exchanges that include Binance, Huobi Global, OKEx, FTX, and Upbit. In which the crypto is available to be traded against fiat currencies, stablecoins, and other cryptos.
With the ongoing developments and upgrades within the THETA platform, it has the high possibility of reaching its ATH soon.
For users’ participation in governance activities, THETA uses a financial incentive scheme. Hence, the THETA network is secured by its own users.
Disclaimer: The opinion expressed in this chart solely author’s. It does not interpreted as investment advice. TheNewsCrypto team encourages all to do their own research before investing.
Recommended for you


