
In Polkadot Technical Analysis 2021, we use past statistics, price patterns, RSI, and much other information about DOT to analyze the future movement of the cryptocurrency.
Polkadot is an open-source sharding multichain protocol that offers the cross-chain transfer of any data type. However, making a huge range of blockchains interoperable with each other. Moreover, the DOT will solve the transaction issue faced by Bitcoin and Ethereum.
Polkadot (DOT) Current Market Status
According to CoinGecko, the Polkadot price is trading at $24.03 with a 24-hour trading volume of $2,348,059,471, at the time of writing. However, DOT has increased by 16% in the last 24 hours.
Moreover, DOT has a circulating supply of 996,535,799 DOT and a maximum supply of 1,077,484,148. Currently, DOT trades in Binance, Huobi Global, OKEx, CoinTiger, and FTX.
Polkadot Technical Analysis 2021
The recent development and upgrades might push Polkadot (DOT) to reach new heights. Now, let’s deep dive into the Polkadot technical analysis 2021.
DOT holds 8th position on CoinGecko right now. The monthly time frame chart of Polkadot (DOT) is shown below.
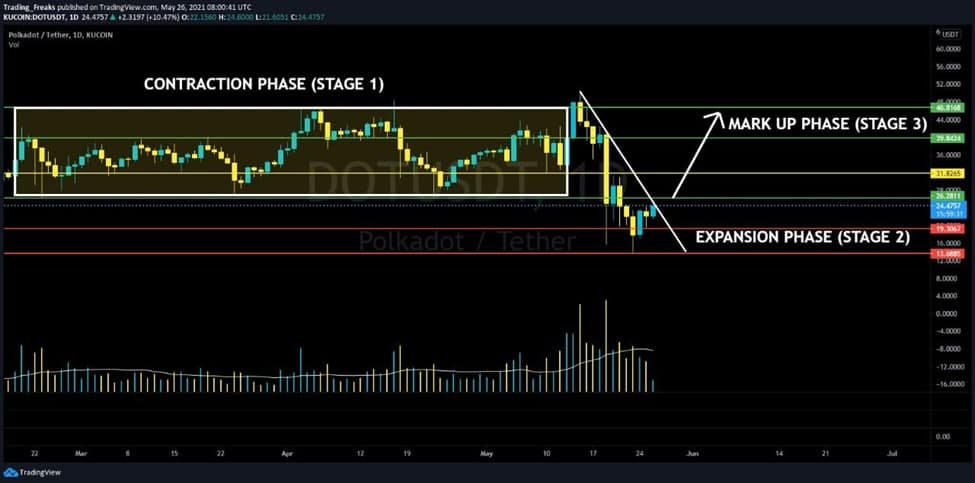
The above chart indicates a Three-Phase pattern. These include the Contraction Phase, Expansion Phase, and Mark-Up Phase. More so, the contraction phase occurs after an All-time High, the price contracts back in the next weekly candle, but not below a previous week’s low.
DOT is currently in the second stage — Expansion Phase, a sudden fall on the coin’s price. This happens mainly due to planned selling or stop loss hunting. Final phase is the Mark Up Phase. However, in this phase big whales might enter the market based on the upcoming volume of the coin.
Polkadot (DOT) RSI, MACD, and MA
The below chart shows the Moving Average Convergence/Divergence (MACD) of DOT. Notably, the MACD (blue) continues to stay just below the signal indicator (orange line). This means that cryptocurrency traders can still expect more bullish days ahead.
In contrast, if the MACD begins to move above the signal indicator and performs a bullish crossover. Then the crypto has a high possibility of reaching new highs.
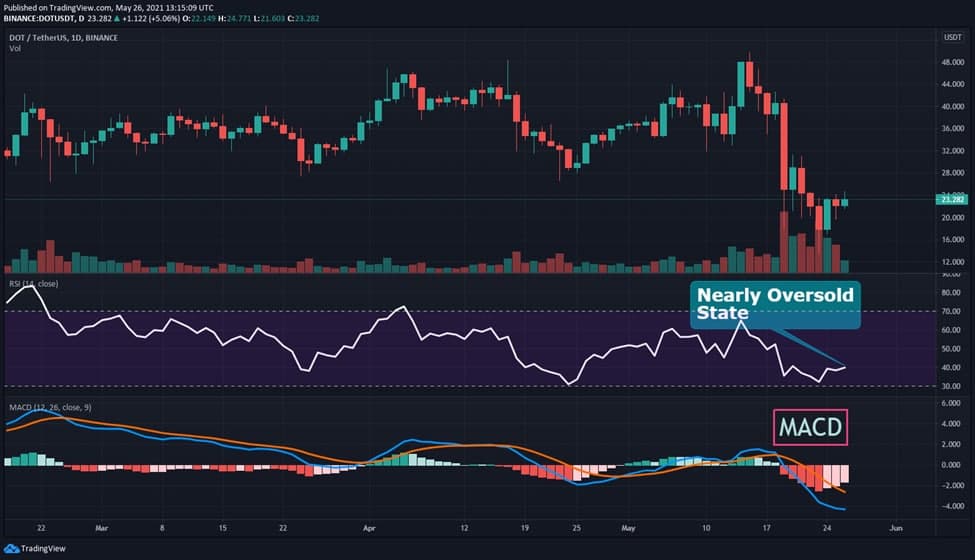
Now let’s look at the relative strength index (RSI) of DOT. As shown in the chart above, the RSI remains at level 38. This shows that DOT’s price is in a nearly oversold state. However, this gives confidence for the traders to trade without any fear.
DOT’s Moving Average (MA) and Exponential Moving Average (EMA) are shown in the chart below. Moreover, MA is a part of technical analysis that helps traders to recognize trends. While EMA is a type of moving average.
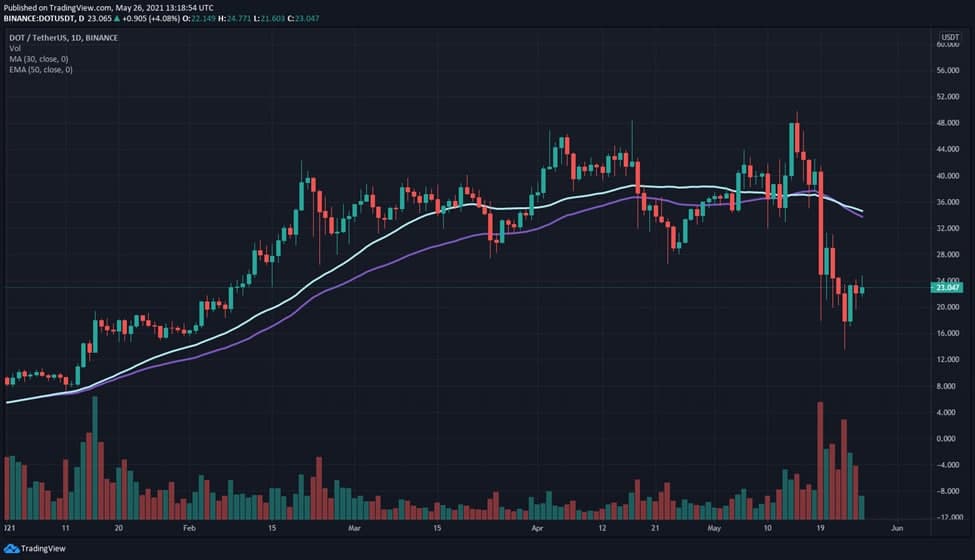
From the beginning of 2021, it is clear that the DOT price has shown many bullish patterns. Furthermore, taking all these into account, DOT could have a competitive market in 2021.
Conclusion
With the ongoing developments and upgrades that are taking place within the DOT platform. The cryptocurrency DOT has a fantastic future ahead in this crypto market. However, it is possible to see DOT reaching new heights.
Bullish DOT price prediction 2021 is $64. As said above, it may reach great heights, however reaching $100 if investors have decided that DOT is a good investment in 2021.
FAQ
DOT is listed on many crypto exchanges that include Binance, Huobi Global, OKEx, CoinTiger, and FTX. In which the crypto is available to be traded against fiat currencies, stablecoins, and other cryptos.
With the ongoing developments and upgrades within the DOT platform, it has the high possibility of reaching its ATH soon.
Polkadot network uses the NPoS (nominated proof-of-stake) procedure to choose validators and nominators and increase chain security. This unique validity methodology helps chains to interact with each other securely under the same rules, however remains governed independently.
Disclaimer: The opinion expressed in this chart solely author’s. It does not interpreted as investment advice. TheNewsCrypto team encourages all to do their own research before investing.
Recommended for You