In Tellor (TRB) Technical Analysis 2021, we use past statistics, price analysis, RVOL, MA, and much other information about TRB to analyze the future trend of the cryptocurrency.
Tellor is a decentralised oracle network that enables Ethereum smart contracts to securely connect to external data sources. TRB is an Ethereum token that powers the Tellor network and encourages honest reporting of external data.
Tellor Tributes (TRB) are the Tellor’s native token. They are used to entice miners to provide data by providing base rewards and tips based on user requests. They are used to govern valid data through disputes, as well as to propose and vote on system upgrades proposed by token holders.
Tellor (TRB) Current Market Status
According to CoinGecko, the TRB price is trading at $51.80 with a 24-hour trading volume of $26,934,905, at the time of writing. However, TRB has dropped to 2.13% in the last 24 hours.
In addition, TRB has a circulating supply of 1,922,949 TRB coins. Currently, TRB trades in Binance, Coinbase Exchange,OKEx, Huobi Global, and ZT.
Tellor (TRB) Technical Analysis 2021
Tellor (TRB) holds the 404th position on CoinGecko right now. The recent development and upgrades might push TRB to reach new heights. Now, let’s deep dive into the TRB technical analysis 2021. The daily time frame chart of Tellor (TRB) is shown below.

The price action contained between two parallel upward sloping lines is defined as an ascending channel. Higher highs and lower lows distinguish this price pattern. An ascending channel is formed by connecting the swing lows with a lower trend line and the swing highs with an upper channel line.
A breakout above an ascending channel may indicate that the upward trend will continue, whereas a breakdown below an ascending channel may indicate that the trend will change.
Currently, TRB trades in a range of $51.80. If the price breaks the trend line resistance level of $72.60 then it will lead to a further surge up to the $233.30 Level. If the trend reverses to the down side, then it will reach the support level at $30.90.
Tellor (TRB) RSI
The below chart shows the relative strength index (RSI) of TRB.
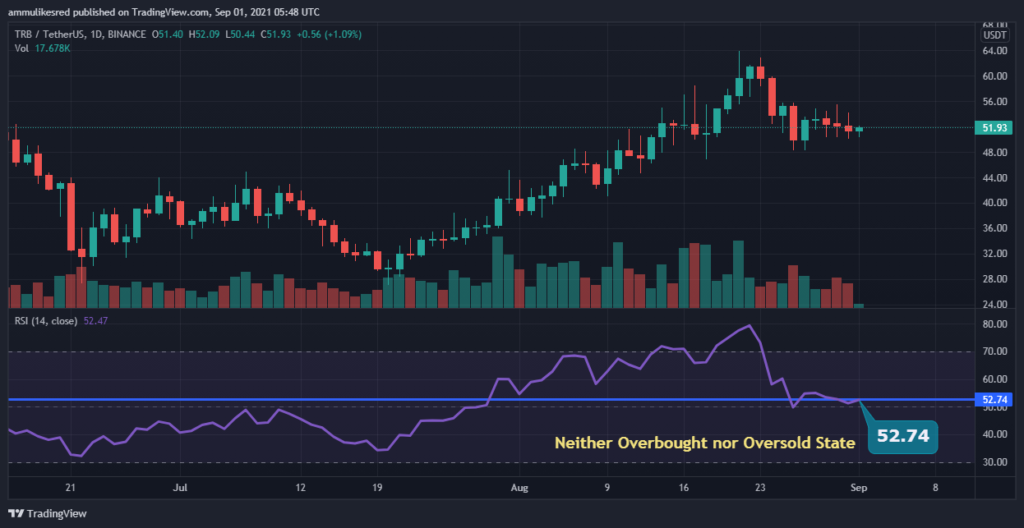
As shown in the above chart, RSI remains at 52.74. This shows that TRB’s price is neither in an overbought or oversold state. This shows that traders have to trade carefully, however, major price reversal could take place.
Tellor (TRB) RVOL
The below chart shows the Relative Volume of TRB. It is an indicator that indicates to traders how the current trading volume has changed over a period of time compared to the previous trading volume.

Currently, the RVOL of TRB lies below the cutoff line which represents the weaker participants in the current trend.
Tellor (TRB) Moving Average
Tellor’s Moving Average (MA) is shown in the chart below. MA supports traders to find trends.
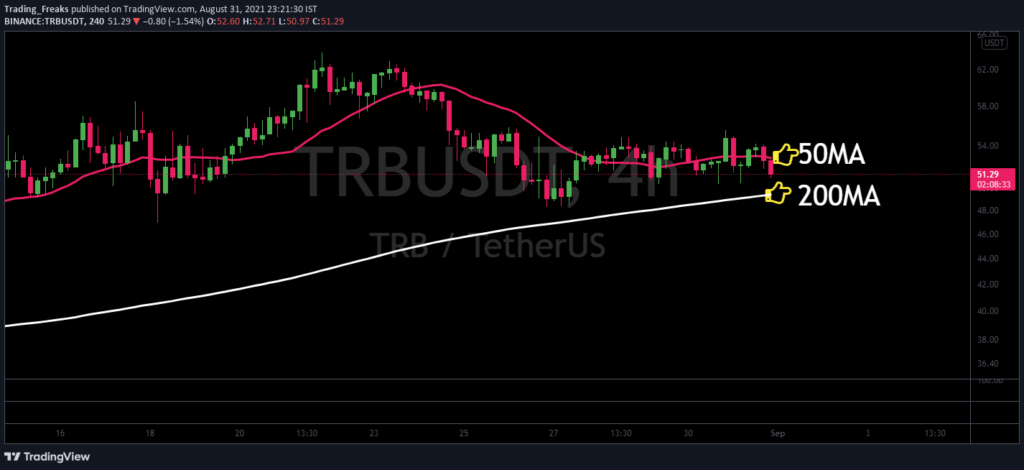
Currently, TRB is in a bullish state. However, TRB price is closely below 50 MA (short-term), and it is now in between 50 MA and 200 MA. Possibly, TRB can also move above 50 MA and 200 MA (long-term) soon.
Once it moves above 50 MA level, it completely goes to a bullish state. Moreover, there is a high possibility of Trend reversal at any time.
Tellor (TRB) Price Comparison With Bitcoin
The below chart shows the price comparison between TRB and BTC.

From the chart, we can identify the trend of the BTC and TRB is moving at the same level as the trend. This indicates when the price of BTC increases or decreases, the price of TRB also increases or decreases respectively.
Conclusion
With the ongoing developments and upgrades that are taking place within the TRB platform. Tellor has a great future ahead in this crypto market. However, TRB can reach new heights.
Bullish TRB price prediction 2021 is $233.30. As mentioned above, it may reach great heights, however reaching $240 is also possible, if investors have decided that TRB is a good investment in 2021.
FAQ
Tellor is a decentralized oracle network that enables Ethereum smart contracts to securely connect to external data sources.
TRB is listed on many cryptocurrency exchanges that include Binance, Coinbase Exchange,OKEx, Huobi Global, and ZT.
With the ongoing developments and upgrades within the TRB platform, it has the high possibility of reaching its ATH soon.
Disclaimer: The opinion expressed in this chart solely author’s. It is not interpreted as investment advice. TheNewsCrypto team encourages all to do their own research before investing.
Recommended for You