In Stealth (XST) Technical Analysis 2021, we use past statistics, price analysis, RVOL, MA, and much other information about XST to analyze the future trend of the cryptocurrency.
Stealth provides an end-to-end security solution using a combination of features including built-in TOR network and XST addresses. Stealth intends to provide private transactions based on zkSNARK. With XST, the transaction Validator buys their right to process the transaction and is rewarded for doing so. These rights are tokenized as a transferable and irreplaceable property called “StealthNodes”, each of which is allocated space in the block validator. This program aims to make Stealth effective.
Stealth (XST) Current Market Status
According to CoinGecko, the XST price is trading at $0.10 with a 24-hour trading volume of $5,445, at the time of writing. However, XST has increased by 8.6% in the last 24 hours.
In addition, XST has a circulating supply of 39,630,017 XSTcoins. Currently, XST trades in Bittrex.
Stealth (XST) Technical Analysis 2021
Stealth (XST) holds the 1467th position on CoinGecko right now. The recent development and upgrades might push XST to reach new heights. Now, let’s deep dive into the XST technical analysis 2021. The weekly time frame chart of Stealth (XST) is shown below.
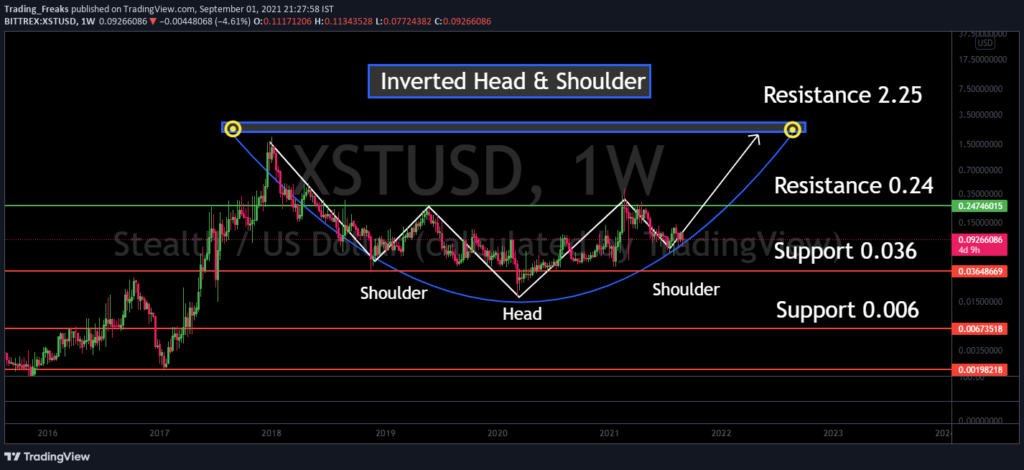
The inverted head and shoulders pattern used as an indicator. This pattern is related to the reversal of the downward trend in prices. This is one of the most common signs of reversal. When the price drops, it will hit a bottom (trough), and then start to recover and rise. Market resistance pushed it back to another trough.
The price fell to the point where the market could not maintain a lower price, and the price began to rise again. Again, market resistance pushed prices down, and prices fell for the last time. If the market cannot support the lower price, the previous low will not be made. This will trigger a higher low before the price rises again. This movement produces three valleys or troughs called the left shoulder, the head, and the right shoulder.
Currently, XST trades in a range of $0.092. If the price breaks the trend line resistance level of $0.24 then it will lead to a further surge up to the $2.25 Level. If the trend reverses to the down side, then it will reach the support level at $0.006.
Stealth (XST) RSI
The below chart shows the relative strength index (RSI) of XST.
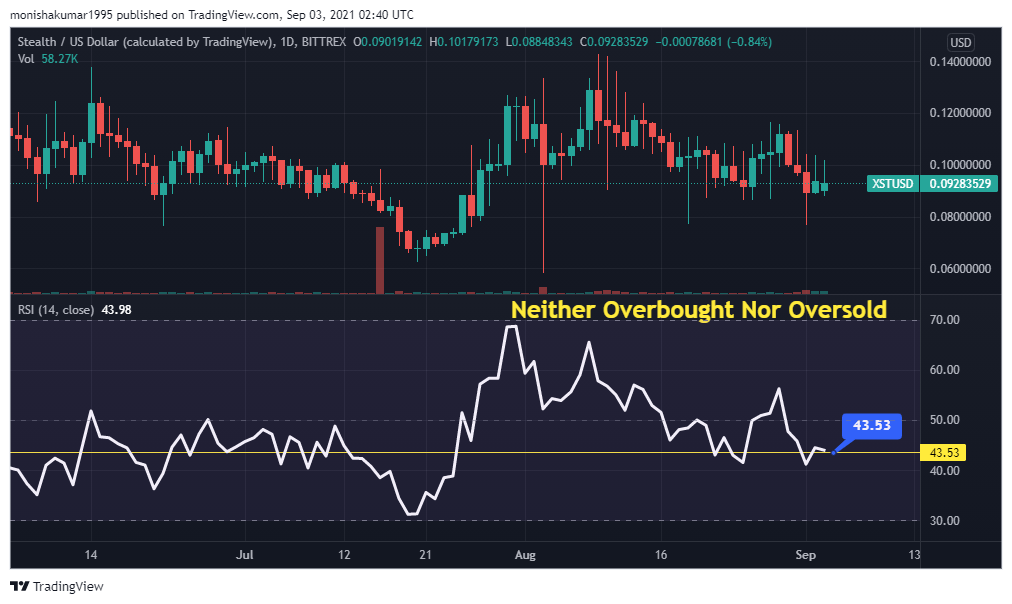
As shown in the above chart, RSI remains at 43.53. This shows that XST’s price is neither in an overbought or oversold state. This shows that traders have to trade carefully, however, major price reversal could take place.
Stealth (XST) RVOL
The below chart shows the Relative Volume of XST. It is an indicator that indicates to traders how the current trading volume has changed over a period of time compared to the previous trading volume.

Currently, the RVOL of XST lies below the cutoff line which represents the weaker participants in the current trend.
Stealth (XST) Moving Average
XST’s Moving Average (MA) is shown in the chart below. MA supports traders to find trends.
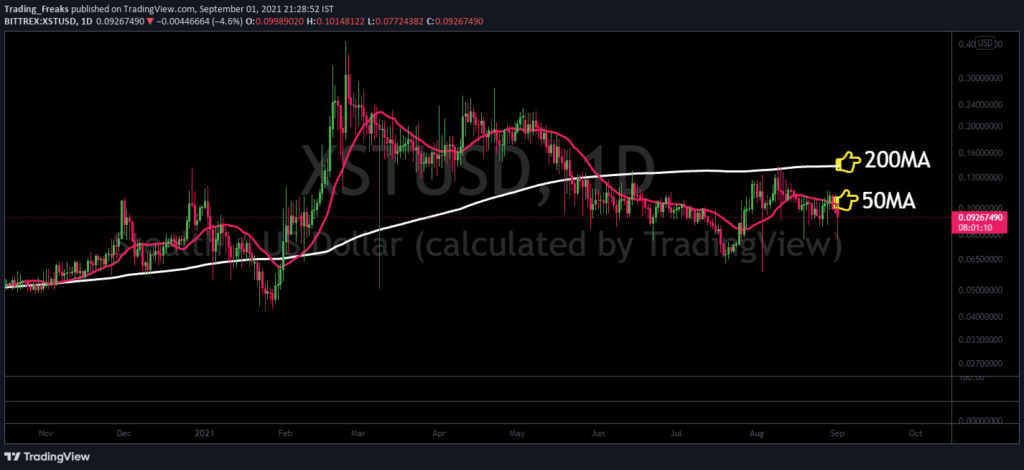
Currently, XST is in a bullish state. However, XST price is closely below 50 MA (short-term), and it is now in between 50 MA and 200 MA. Possibly, XST can also move above 50 MA and 200 MA (long-term) soon.
Once it moves above 50 MA level, it completely goes to a bullish state. Moreover, there is a high possibility of Trend reversal at any time.
Stealth (XST) Price Comparison With Bitcoin
The below chart shows the price comparison between XST and BTC.
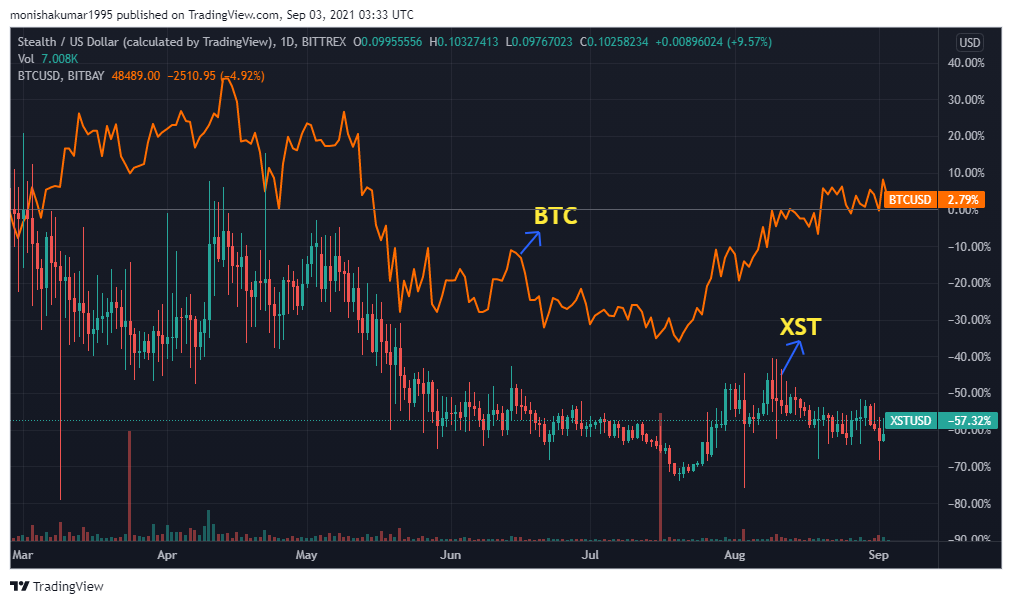
From the chart, we can identify the trend of the BTC and XST is moving at the same level as the trend. This indicates when the price of BTC increases or decreases, the price of XST also increases or decreases respectively.
Conclusion
With the ongoing developments and upgrades that are taking place within the XST platform. Stealth has a great future ahead in this crypto market. However, XST can reach new heights.
Bullish XST price prediction 2021 is $0.24. As mentioned above, it may reach great heights, however reaching $2.25 is also possible, if investors have decided that XST is a good investment in 2021.
FAQ
XST is fairly distributed with almost four hours of low block rewards, a small 1% premium, and long-term Proof-of-Stake minting energy efficiency.
XST is listed on Bittrex cryptocurrency exchange.
With the ongoing developments and upgrades within the XST platform, it has the high possibility of reaching its ATH soon.
Disclaimer: The opinion expressed in this chart solely author’s. It is not interpreted as investment advice. TheNewsCrypto team encourages all to do their own research before investing.
Recommended for You