
In Reef Technical Analysis 2021, we use past statistics, price patterns, RSI, and much other information about REEF to analyze the future movement of the cryptocurrency.
Reef (REEF) is a decentralized finance (DeFi) platform developed on Polkadot that aims to provide cross-chain trading. Moreover, a yield engine and a smart liquidity aggregator are among the project’s offerings.
More so, Reef is moved towards newcomers, and also to current DeFi users who see it difficult to keep up with the best investment methodologies. Moreover, the company also looks to tackle high gas fees that could be seen on the ETH blockchain, which some claim renders DeFi protocols ‘unstable’.
Reef Current Market Status
According to CoinGecko, the Reef price is trading at $0.024 with a 24-hour trading volume of $51,358,475, at the time of writing. However, REEF has increased by 2.5% in the last 24 hours.
Moreover, Reef has a circulating supply of 12,666,667,338 REEF and a maximum supply of 20,000,000,000. Currently, REEF trades in Binance, Huobi Global, OKEx, ZG.com, and CoinTiger.
Reef Technical Analysis 2021
The recent development and upgrades might push Reef (REEF) to reach new heights. Now, let’s deep dive into the REEF technical analysis 2021. The weekly time frame chart with two views of the pattern of Reef (REEF) is shown below.
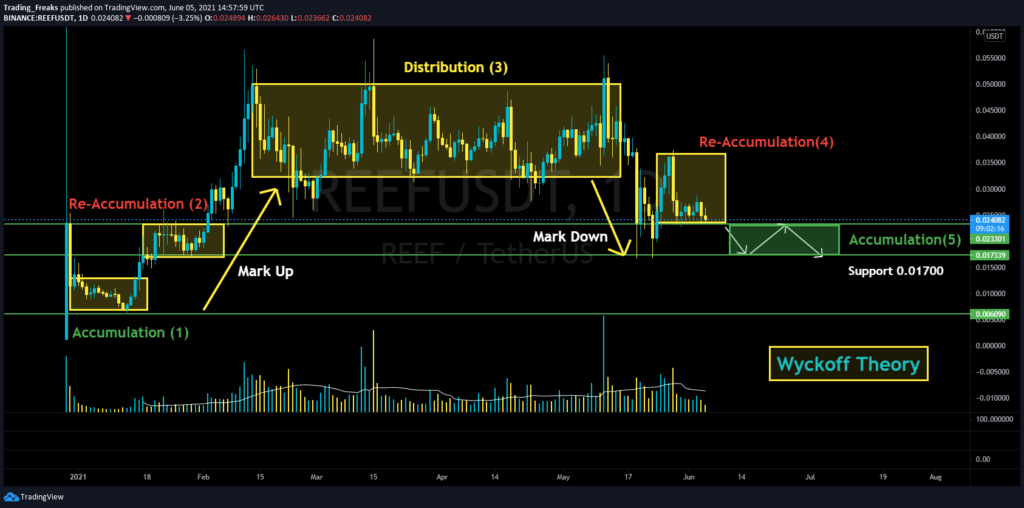
Wyckoff states that every cause in the market will lead to a proportional effect. However, this can be explained using accumulation and distribution stages. More so, accumulation indicates Markup and price increases. Notably, the price increases when the token breaks the accumulation resistance. On the other hand, distribution leads to Markdown and the price decreases. For instance, the price falls when the token breaks the support.
As per the chart above, the chart signal starts with the accumulation phase which could also be said as lower price buy level. Then the pattern enters the re-accumulation phase. This is similar to accumulation but present in a little higher price level.
Then the signal enters the distribution phase. At this level, the price maintains its position in a particular range. Moreover, in this phase, if it breaks the high level, it indicates bullish days ahead. In contrast, if it breaks the low level then it indicates bearish.
Then again the signal enters the mark down phase. It enters into re-accumulation and then it is expected to enter the accumulation phase once again.
Reef (REEF) RSI, MACD, and MA
The below chart shows the Moving Average Convergence/Divergence (MACD) of REEF. Notably, the MACD (blue) stays just below the signal indicator (orange line). This means that cryptocurrency traders can still expect more bearish days ahead.
In contrast, if the MACD begins to move above the signal indicator and performs a bearish crossover. Then the crypto has a high possibility of reaching new lows.
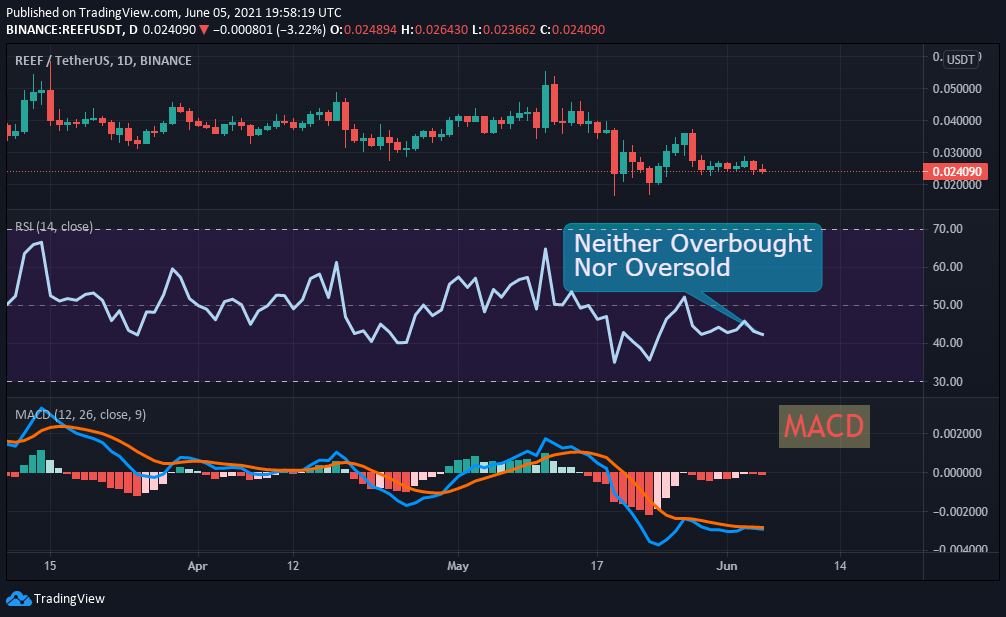
Now let’s look at the relative strength index (RSI) of REEF. As shown in the chart above, the RSI remains at level 43. This shows that REEF’s price is in neither an overbought nor an oversold state. However, this gives confidence for the traders to trade without any fear.
Reef’s Moving Average (MA) and Exponential Moving Average (EMA) is shown in the chart below. Moreover, MA is a part of technical analysis that helps traders to recognize trends. While EMA is a type of moving average.
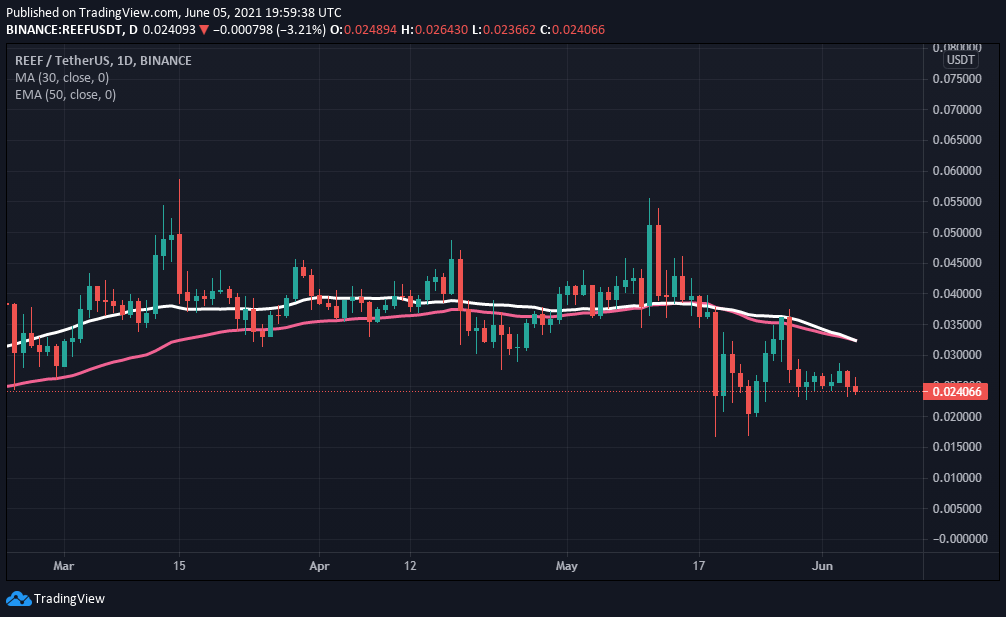
From the beginning of 2021, it is clear that the REEF price has shown many bullish patterns. Furthermore, taking all these into account, REEF could have a competitive market in 2021.
Conclusion
With the ongoing developments and upgrades that are taking place within the REEF platform. The cryptocurrency REEF has a fantastic future ahead in this crypto market. However, it is possible to see REEF reaching new heights.
Bullish REEF price prediction 2021 is $0.05. As said above, it may reach great heights, however reaching $0.5 if investors have decided that REEF is a good investment in 2021.
FAQ
Reef is a decentralized finance (DeFi) platform developed on Polkadot that focus to provide cross-chain trading. It’s native token is REEF.
REEF is listed on many crypto exchanges that include Binance, Huobi Global, CoinTiger, FTX, and HitBTC. In which the crypto is available to be traded against fiat currencies, stablecoins, and other cryptos.
With the ongoing developments and upgrades within the REEF platform, it has the high possibility of reaching its ATH soon.
Disclaimer: The opinion expressed in this chart solely author’s. It does not interpreted as investment advice. TheNewsCrypto team encourages all to do their own research before investing.
Recommended for you