


In IOTA (MIOTA) Technical Analysis 2021, we use past statistics, price analysis, RSI, RVOL, and much other information about MIOTA to analyze the future movement of the cryptocurrency.
IOTA is a distributed ledger containing only one difference, it is not actually a blockchain. But rather its proprietary technology is called Tangle, which is a system of nodes that confirm transactions. Moreover, the foundation behind this project says this provides far greater speeds than conventional blockchains. In addition, an ideal footprint for the ever-growing Internet of Things ecosystem.
IOTA (MIOTA) Current Market Status
According to CoinMarketCap, the MIOTA price is trading at $0.87 with a 24-hour trading volume of $42,970,290, at the time of writing. However, IOTA has decreased by 3.79% in the last 24 hours.
In addition, MIOTA has a circulating supply of 2.78B MIOTA. Currently, MIOTA trades in Binance, OKEx, Huobi Global, FTX, and Upbit.
IOTA (MIOTA) Technical Analysis 2021
IOTA (MIOTA) holds the 44th position on CoinMarketCap right now. The recent development and upgrades might push MIOTA to reach new heights. Now, let’s deep dive into the MIOTA technical analysis 2021. The weekly time frame chart of IOTA (MIOTA) is shown below.

The above chart shows the Cup With Handle pattern of MIOTA. This graph represents a period of consolidation which might result and reach an immediate price breakout or breakdown. A breakdown from the lower line indicates the start of a new bearish signal, while a breakout from the upper line shows the start of a new bullish signal.
In the monthly time frame chart, it is possible for the MIOTA to reach $2.7 if the bull trend continues. Or else, if the price of the MIOTA breaks the support level of $0.6, it will fall to the next support level at $0.13. So, the trend of the MIOTA is based on the breakout.
IOTA (MIOTA) RSI
The below chart shows the relative strength index (RSI) of MIOTA.

As shown in the below chart, RSI remains at 43. This shows that MIOTA’s price is in a neither overbought nor oversold state. However, this shows that traders can trade fearlessly.
IOTA (MIOTA) RVOL
Accordingly, the below chart shows the Relative Volume of MIOTA. RVOL is an indicator that represents to traders how the current trading volume has changed over a period of time compared to the past trading volume.
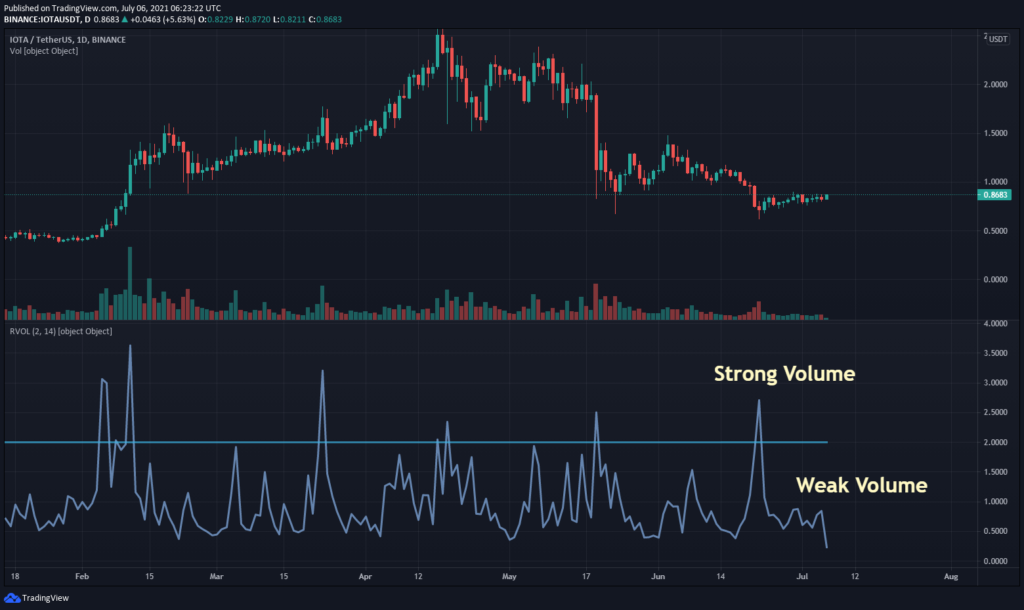
Notably, in the last week of June, it found that the RVOL of MIOTA observed weaker. Currently, the RVOL of MIOTA remains below the cutoff line which represents the weaker participants in the current trend.
IOTA (MIOTA) Moving Average
MIOTA’s Moving Average (MA) is shown in the chart below. Moving Average is a part of technical analysis that supports traders to find trends.
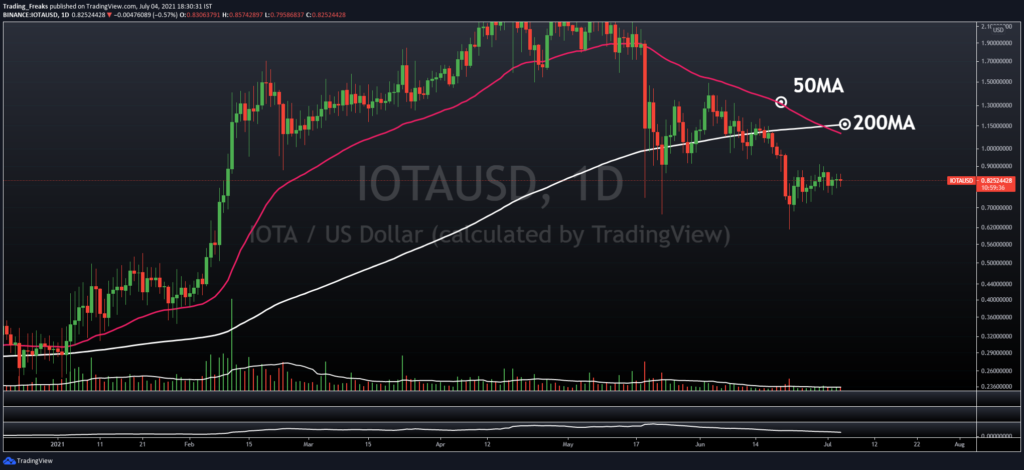
In the 50 MA (Short-term), the price of the MIOTA is in a bullish state, and it has broken the 200 MA. However, it will completely go to a bearish state. Currently, the price of MIOTAis trading above the 200 MA level so we can expect more bullish in upcoming days.
IOTA (MIOTA) Price Comparison With Bitcoin
The below chart shows the price comparison between MIOTA and BTC.
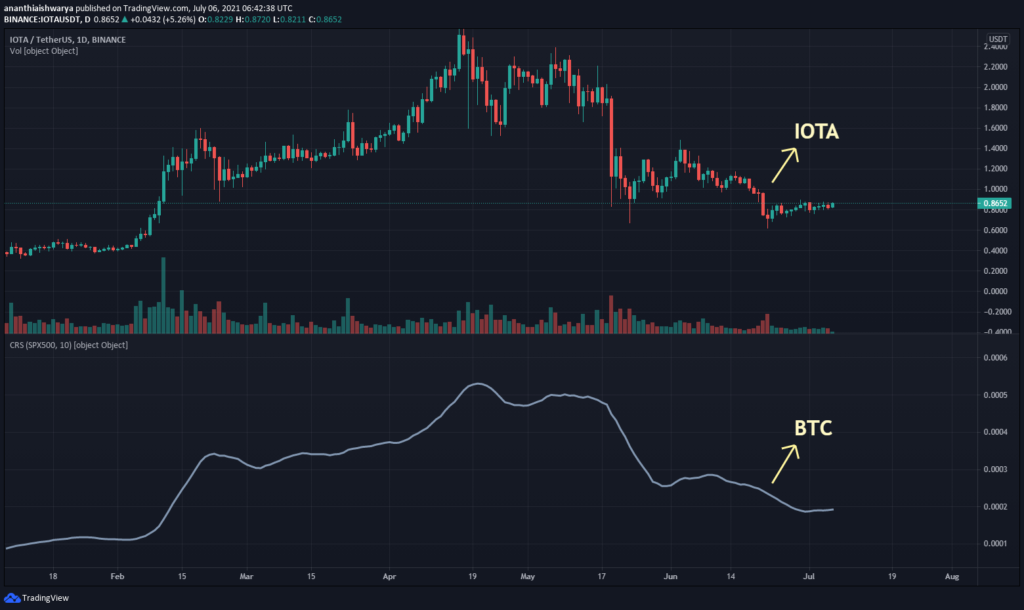
From the chart, we can identify the trend of the BTC and MIOTA is moving at the same level as the trend. This indicates when the price of BTC increases or decreases, the price of MIOTA also increases or decreases respectively.
Conclusion
With the ongoing developments and upgrades that are taking place within the MIOTA platform. IOTA has a great future ahead in this crypto market. However, MIOTA can reach new heights.
Bullish MIOTA price prediction 2021 is $2.7. As mentioned above, it may reach great heights, however reaching $3, if investors have decided that MIOTA is a good investment in 2021.
FAQ
IOTA is a distributed ledger containing only one difference, it is not actually a blockchain. But rather its proprietary technology is called Tangle, which is a system of nodes that confirm transactions. Its native token is MIOTA.
MIOTA is listed on many cryptocurrency exchanges that include Binance, OKEx, Huobi Global, FTX, and Upbi. It is present for trading against crypto fiat coins, stablecoins, and other cryptocurrencies.
With the ongoing developments and upgrades inside the MIOTA platform, it has a high possibility of reaching its ATH soon.
Disclaimer: The opinion expressed in this chart solely author’s. It does not interpreted as investment advice. TheNewsCrypto team encourages all to do their own research before investing.
Recommended for you