In Ethereum Technical Analysis 2021, we use past statistics, price patterns, RSI, and much other information about ETH to analyze the future movement of the cryptocurrency.
Ethereum is the second largest crypto in the market. It is a decentralized open-source blockchain platform that features its own cryptocurrency, Ether. ETH stays as a platform for numerous other cryptos, as well as for the decentralized smart contracts execution.
Ethereum (ETH) Current Market Status
According to CoinGecko, the Etherum price is trading at $2,534.95 with a 24-hour trading volume of $39,252,607,613, at the time of writing. However, ETH has increased by 7.1% in the last 24 hours.
Moreover, ETH has a circulating supply of 116,100,134 ETH and a maximum supply of infinity. Currently, ETH trades in Binance, Huobi Global, ZG.com, OKEx, and CoinTiger.
Ethereum Technical Analysis 2021
The recent development and upgrades might push Ethereum (ETH) to reach new heights. Now, let’s deep dive into the Ethereum technical analysis 2021. The weekly time frame chart of Ethereum (ETH) is shown below.
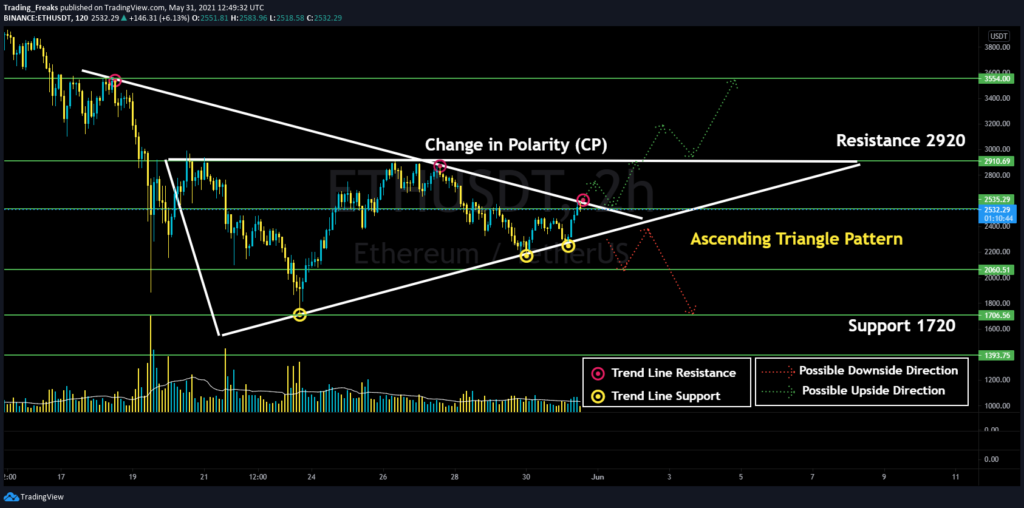
The above chart shows the Ascending Triangle pattern. An ascending triangle is a chart pattern used in technical analysis. It is created by price moves that allow for a horizontal line to be drawn along the swing highs, and a rising trendline to be drawn along the swing lows. The two lines form a triangle. Traders often watch for breakouts from triangle patterns. In simple terms, the price of ETH might surge to almost $2920, a bullish signal.
Change in Polarity (CP) — according to this principle, whenever support is broken, its role is reversed and it starts to act as new resistance. Similarly, when any resistance is broken, it changes its role and tends to act as the new support level for the price.
Ethereum (ETH) RSI, MACD, and MA
The below chart shows the Moving Average Convergence/Divergence (MACD) of ETH. Notably, the MACD (blue) continues to stay just below the signal indicator (orange line). This means that cryptocurrency traders can still expect more bearish days ahead.
In contrast, if the MACD begins to move above the signal indicator and performs a bearish crossover. Then the crypto has a high possibility of reaching new highs.
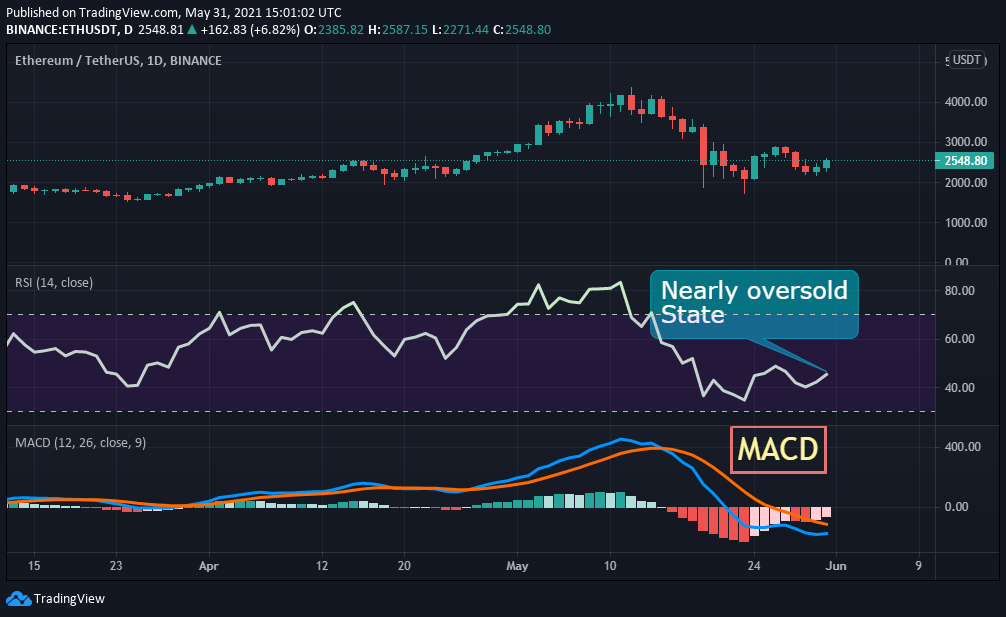
Now let’s look at the relative strength index (RSI) of ETH. As shown in the chart above, the RSI remains at level 44. This shows that ETHs price is in a nearly oversold state. However, this gives confidence for the traders to trade without any fear.
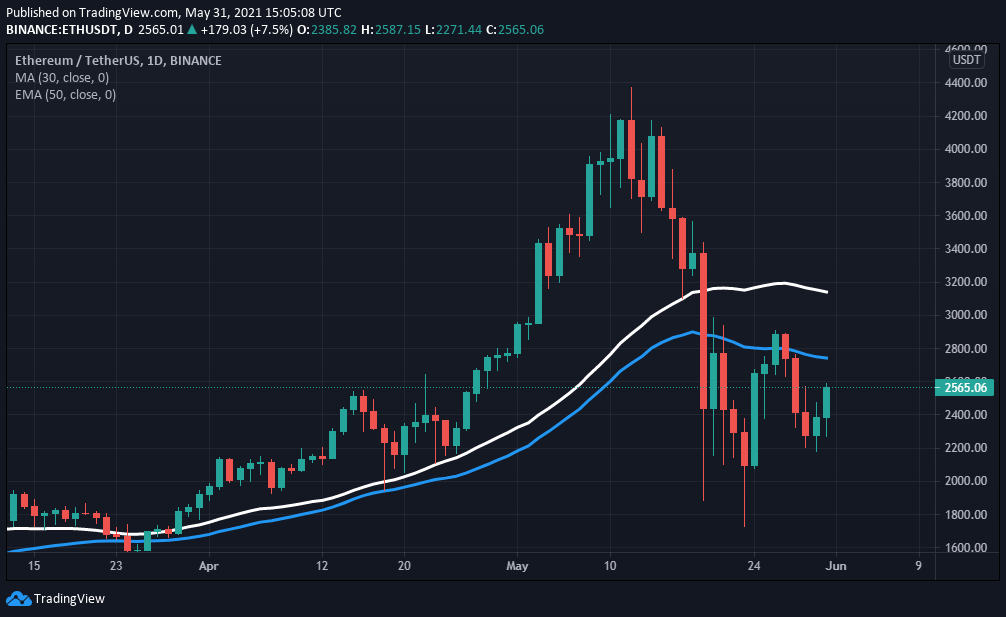
From the beginning of 2021, it is clear that the ETH price has shown many bullish patterns. Furthermore, taking all these into account, ETH could have a competitive market in 2021.
Conclusion
With the ongoing developments and upgrades that are taking place within the ETH platform. The cryptocurrency ETH has a fantastic future ahead in this crypto market. However, it is possible to see ETH reaching new heights.
Bullish ETH price prediction 2021 is $3,500. As said above, it may reach great heights, however reaching $7,000 if investors have decided that ETH is a good investment in 2021.
FAQ
ETH is listed on many crypto exchanges that include Binance, Huobi Global, ZG.com, OKEx, and CoinTiger. In which the crypto is available to be traded against fiat currencies, stablecoins, and other cryptos.
With the ongoing developments and upgrades within the ETH platform, it has the high possibility of reaching its ATH soon.
As of August 2020, Ethereum is secured via the Ethash proof-of-work algorithm, and belongs to the Keccak family of hash functions. However, to transition the network to a proof-of-stake algorithm connected to the major Ethereum 2.0 updated, which launched in late 2020.
Disclaimer: The opinion expressed in this chart solely author’s. It does not interpreted as investment advice. TheNewsCrypto team encourages all to do their own research before investing.
Recommended for You


