



- The DOGE price is currently hovering at the $0.083 mark.
- The short-term moving average is lower than the long-term.
Dogecoin (DOGE) is the first and most famous dog-themed token, and it hit $0.1007 on August 22 and has since retraced more than 17% to current levels. At press time, the meme coin is trading at $0.08318, with a value rise of over 3%, and with the volume settled at $594.58 million.
It’s worth noting that the 24-hour session has ranged between $0.08067 and $0.08359, with the 7-day range sitting between $0.08021 and $0.0902.
Significantly, the Tom DeMark Sequential has flashed a buy signal, and that has indicated the end of a corrective phase for DOGE. Alongside that, a morning doji star has formed on the daily chart, a bullish reversal pattern that appears near the end of a downtrend as selling momentum fades and buyers begin stepping in.
Moreover, the large holders have accumulated more than 400 million DOGE over the past five days. That’s not retail buying the dip; that is whale-level conviction at current prices.
Looking at Where the DOGE’s Momentum Goes
The $0.0813 support level is the line that holds this entire setup together. Almost 35 billion DOGE were previously traded at that level, making it a major floor. As long as it holds, the bullish case stays intact.
On the upside, $0.1552 is the first crucial target, with $0.1774 as the next major resistance beyond that. The $0.0813 ground is the one number that decides whether this is a reversal or just a temporary bounce.
The 4-hour chart shows that the Moving Average Convergence Divergence (MACD) line crosses above the signal line, but both lines remain below zero. It hints at a bullish recovery attempt within an overall downtrend. The market context is bearish, with the short-term moving average lower than the long-term.
The buyers are attempting to push the DOGE price higher. Also, this gives an early warning signal that the downtrend is weakening. However, as both lines are below zero, it carries higher risk; traders often treat it as a potential trend reversal.
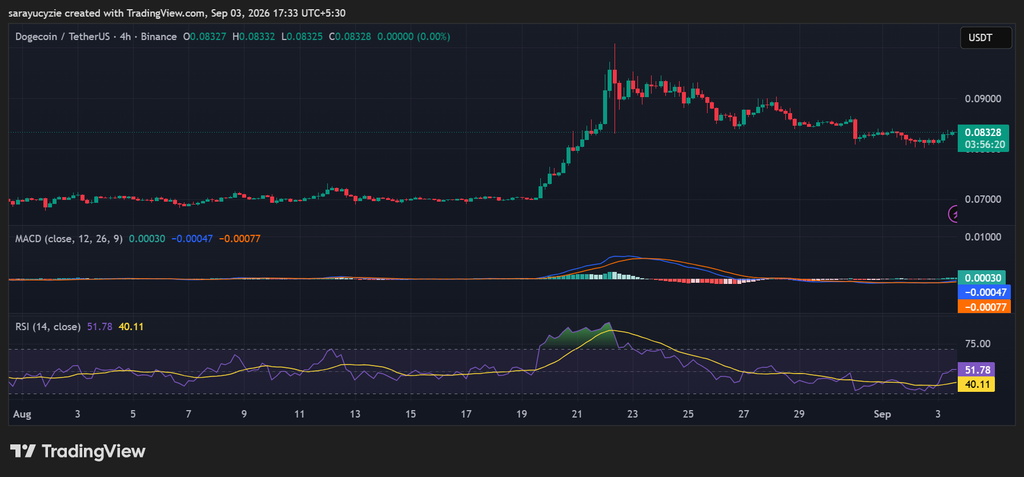
In addition, the daily Relative Strength Index (RSI) reading is resting at 51.78, indicating a completely neutral market. It reveals that neither bulls nor bears are driving price action. The upward price movements have slightly edged out downward moves over recent candles, but the difference is negligible.
At this value, it reflects that the market is at equilibrium. Furthermore, traders look for a breakout above 60 to confirm accelerating bullish momentum, or a drop below 40 to signal that the bears are taking over control.
Crypto Market Highlights
Ethereum (ETH) Is Standing Its Ground: The Chart Is Starting to Point Toward $3K