
Ethereum, which has led the crypto market for the last month, still shows conviction as it retreats to prior peaks. The second market cap cryptocurrency has slowed down in the past day but still looks optimistic with more short-term increases.
This fractal indicates that the cryptocurrency will go upwards for Ethereum towards the end of August. At that point, ETH investors may experience additional pullbacks along the road.
After successfully launching its ‘London’ upgrade earlier this month, the Ethereum price (ETH) showed enormous strength. One of the advances with this update is that ETH is now burnt by each transaction, bringing ETH closer to a deflationary asset.
More than 71,000 ETH had been burned since this update at the time of writing. Investors have taken a positive position, and ETH has been in a strong upgrade since the upgrade took place. As long as the BTC remains stable, ETH will probably soon reach mid $3000.
Momentum Towards a Significant Rise
Looking over the past ten trading days, we can observe how ETH has developed a rising channel (potential bull flag). Bulls have consolidated below a trend line of over nine months, which kept the ETH price until mid-June. Ethereum must recover its momentum towards a significant rise.
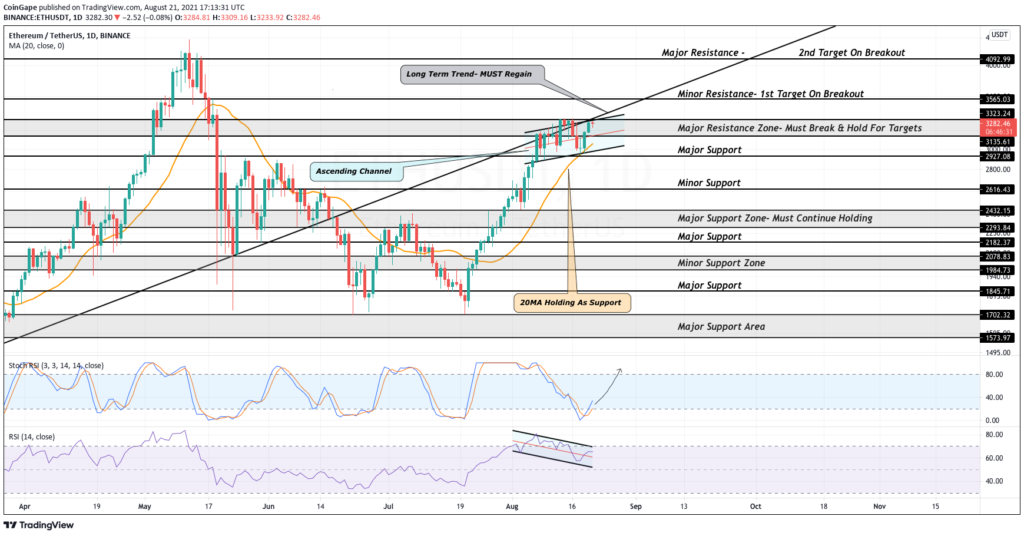
Since the ETH price broke above $2,000, the 20-day MA has been maintained. This MA is a valuable measure to evaluate whether or not the price is on an uptrend. If ETH breaks at any point below this MA, we should anticipate additional downturns into a possible short-term trend.
Looking at the Stochastic RSI, we can observe how strength resets the oversold area. This is a good situation since it indicates that pricing recovers strength for a future rise. As long as the stochastic is above the 20 mark, a bullish breakdown should be expected shortly. The relative strength index shows a subtle pattern of the bull flag pattern.
Recommended for You