
- Binance Coin (BNB) struggles to break $645 resistance despite a 3% daily gain.
- The RSI at 65.03 and the MACD above the signal line suggest strong buying momentum.
Binance Coin (BNB) is battling a key resistance level at $640, showing signs of a potential breakout despite recent market fluctuations. Over the past 24 hours, BNB has climbed by 3%, sparking discussions about whether it can sustain this upward momentum or face another correction.
Currently, BNB is trading around $642, marking its highest price since February 24. The token recorded an intraday high of $644.87. BNB has gained strength following a significant 25% dip between mid-February and March, indicating that it may have moved past its corrective phase. Trading volume has also surged by 50% to $2.04 billion, reflecting increased market activity.
BNB’s price rally follows the global market recovery, which has seen several altcoins bounce back from their monthly lows with Bitcoin (BTC) soared to $87K. However, a technical analysis of BNB shows deeper insights into Binance Coin’s performance and short-term potential.
BNB’s 24-H Technical Outlook: Bullish or Bearish?
From a technical perspective, on the daily chart, BNB is forming a V-shaped recovery, signaling a strong rebound from previous lows. The token has surpassed the $607 support level, reinforcing the uptrend. The Relative Strength Index (RSI) is currently at 65.03 on the 4-hour chart, suggesting bullish momentum without being overbought.
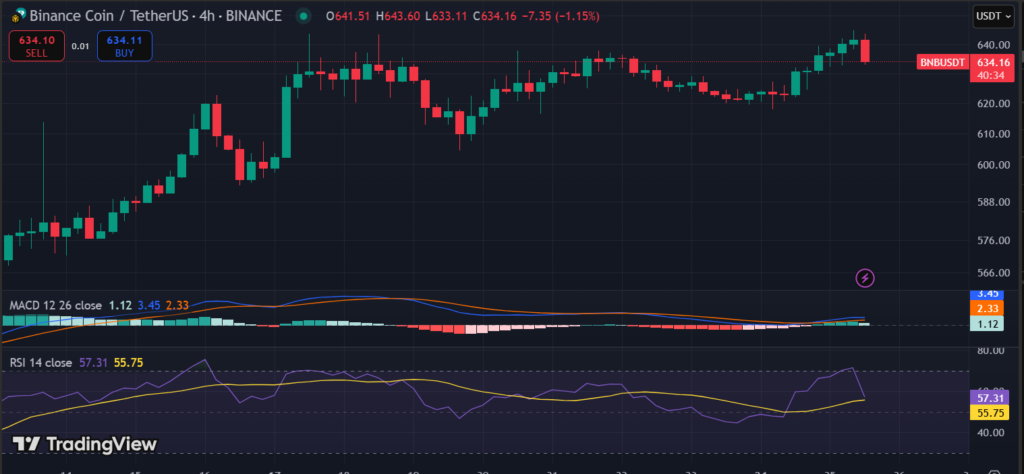
Additionally, the MACD indicator remains above the signal line, further supporting the possibility of continued price growth. Furthermore, the Supertrend indicator displays a green line beneath the price, signaling strong support and a potential for further upward movement.
If BNB maintains this momentum, it could break past $670 and push toward $700 or even $750 in an extended rally. However, if the price fails to hold above the current trendline, it may drop to $585, with a potential further decline to $555, which would invalidate the bullish outlook.