- BNB has hit a new ATH of $851, soaring by over 6%.
- Its daily trading volume has surged by more than 77%.
The crypto market started the trading day with a modest recovery of 1.59% to $3.97 trillion, with some digital assets climbing and some plunging. Meanwhile, the assets like OP, CAKE, SPX, and ENA took the spotlight among the top gainers, posting double-digit gains. One of the trending tokens is BNB, which hit its new all-time high at $851.98.
The asset has surged by over 6.21%, and in the early hours, it traded at a bottom range of $793.85. With the sudden bullish shift, it has mounted up, breaking the crucial resistance between $793.91 and $851.91 zones.
The recovery made BNB trade within the $844.69 range, with a market cap of $117.9 billion. The daily trading volume has soared by over 77.23%, reaching $3.28 billion. Moreover, the BNB market has seen $3.77 million liquidated.
Can the Bulls Keep BNB’s Momentum Alive?
The Moving Average Convergence Divergence (MACD) line of BNB is settled above the signal line, indicating bullish momentum, and the price is gaining upward strength and may continue rising. Besides, the asset’s Chaikin Money Flow (CMF) indicator at 0.25 suggests a strong buying pressure in the market — a bullish sign. Also, the positive value hints that the money is flowing into the asset.
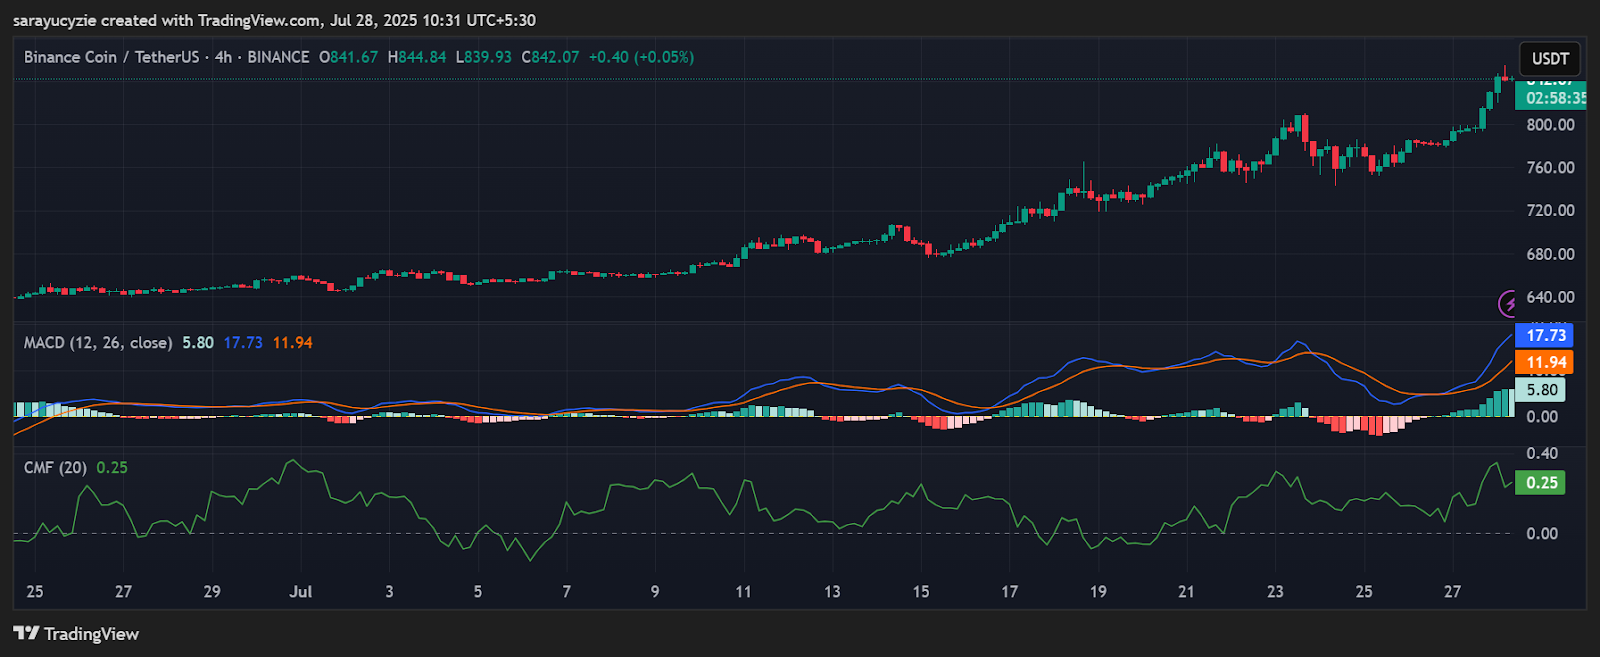
On the four-hour charts, the BNB/USDT pair unveils a bullish pattern. After multiple ups and downs, a sturdy green candle has formed, swallowing the previous candle. The price could rise to $844.76. Additional corrections on the upside might trigger the golden cross to occur, and the bulls could send the price above $844.83.
Contrarily, assuming the asset prints a cautious price graph, with the red candles, the bearish signal might push the price down to the $844.61 level. Further downside correction could initiate the emergence of a death cross, and the mighty bears may likely drive the BNB price to its previous low at around $844.53 or even lower.
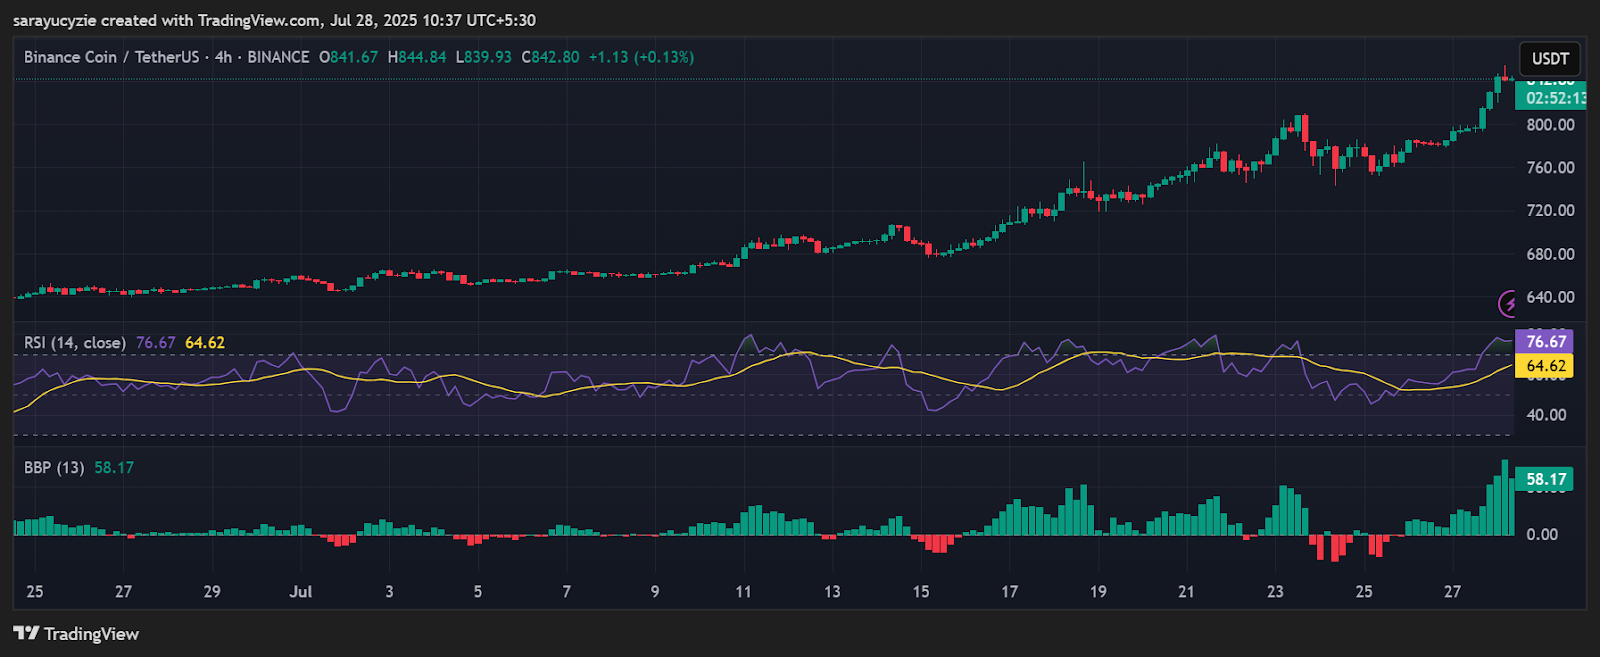
Additionally, the daily Relative Strength Index (RSI) found at 76.67 points that the asset is in the overbought zone, with a potential pullback or cool-off approaching. BNB’s Bull Bear Power (BBP) reading of 58.17 signals a strong bullish dominance in the market. Notably, the buyers are currently having the upper hand, and it is pushing the price significantly above.
In conclusion, the recent trading pattern shows that the bullish momentum is lingering in the market. For a forward-looking perspective, check out our complete price outlook: Binance Coin (BNB) Price Prediction 2025, 2026–2030.