- BNB price consolidates within a defined range, showing reduced volatility.
- Technical indicators (EMAs, SMAs, ATR, Bollinger Bandwidth) suggest market indecision.
- Potential price targets: $560.90 on bullish breakout, $522.90 if bearish sentiment prevails.
Binance Coin (BNB) has entered a period of consolidation, characterized by a gradual decrease in market volatility and price movement within a defined range. This shift is evident on the one-day chart, where key technical indicators paint a picture of market indecision and reduced price fluctuations.
The flattening of BNB’s 20-day exponential moving average (EMA) and 50-day simple moving average (SMA) since August 26 serves as a clear indicator of this consolidation phase.
The 20-day EMA, known for its quick response to price changes, and the 50-day SMA, representing a longer-term trend, have both lost their directional bias. This convergence of moving averages typically signals a market in equilibrium, where neither buyers nor sellers have gained a decisive upper hand.

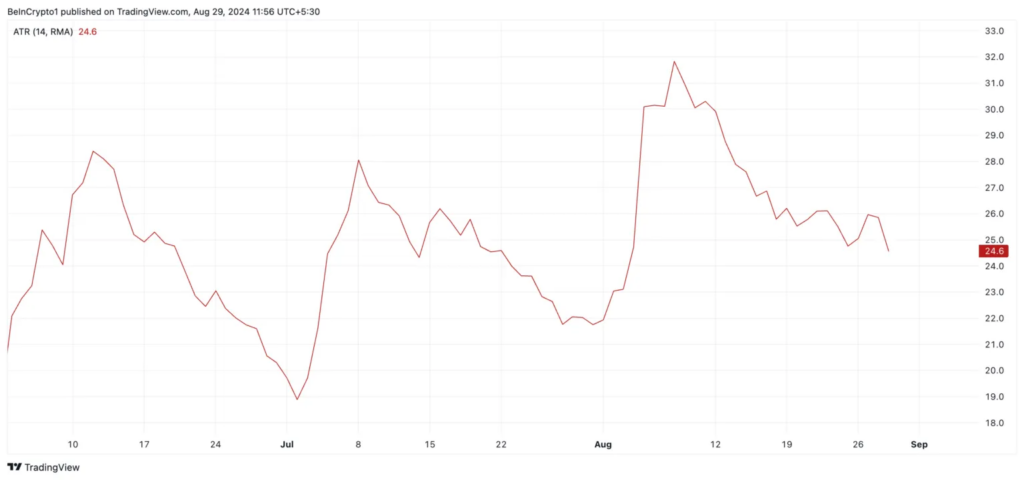
BNB’s ATR trends downward
Supporting this narrative of reduced volatility, BNB’s Average True Range (ATR) has been trending downward, currently standing at 24.6. The ATR, a key measure of market volatility, suggests that BNB’s price is experiencing less fluctuation, further confirming the onset of a consolidation phase.
This reduced price movement indicates that traders may need to adjust their strategies for a market environment characterized by narrower trading ranges.
Complementing the ATR, BNB’s Bollinger Bandwidth has also been on a downward trajectory, registering 18.48 at the latest reading. The declining bandwidth indicates that the Bollinger Bands are contracting, another hallmark of low market volatility.
This technical setup often precedes significant price movements, as periods of low volatility are typically followed by breakouts in either direction.
The current sideways trading pattern for BNB reflects a delicate balance between buying and selling pressures.


