In Avalanche (AVAX) Technical Analysis 2021, we use past statistics, price analysis, RSI, RVOL, and much other information about AVAX to analyze the future movement of the cryptocurrency.
Avalanche is an umbrella project for launching decentralized finance (DeFi) applications, financial assets, trading, and other services. Moreover, the project aims to be a global assets exchange, enabling anyone to launch or trade any form of asset and control it in a decentralized way utilizing smart contracts and other cutting-edge technologies.
Developers at Ava Labs claim that Avalanche is the first smart contracts platform to offer transaction finalization in the way one second as standard. Moreover, the Avalanche launched its mainnet in September 2020. The platform’s native token, AVAX, performs different tasks within Avalanche and also works as a rewards and payment system for users.
Avalanche (AVAX) Current Market Status
According to CoinMarketCap, the AVAX price is trading at $11.83 with a 24-hour trading volume of $65,423,598, at the time of writing. However, AVAX has decreased by 3.94% in the last 24 hours.
In addition, AVAX has a circulating supply of 172,418,164.00 AVAX AVAX. Currently, AVAX trades in Binance, OKEx, Huobi Global, and many more.
Avalanche (AVAX) Technical Analysis 2021
Avalanche (AVAX) holds the 47th position on CoinMarketCap right now. The recent development and upgrades might push AVAX to reach new heights. Now, let’s deep dive into the AVAX technical analysis 2021. The weekly time frame chart of Avalanche (AVAX) is shown below.
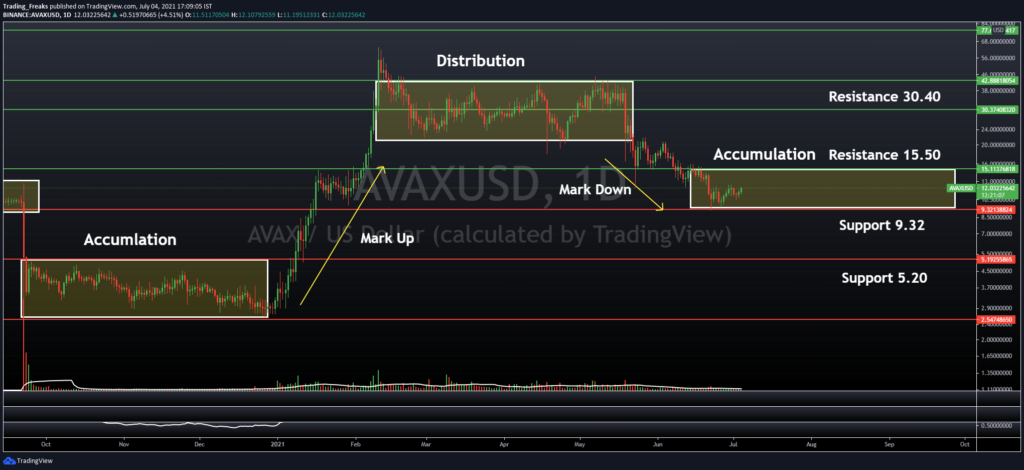
Wyckoff creates a price action market theory that is still widely utilized in trading today. According to the Wyckoff method, the price cycle of a traded instrument has four phases: accumulation, markup, distribution, and markdown.
Accumulation Phase: The accumulation process is explained on the chart by a ranging price form. Moreover, the bulls receive power gradually, however, they are positioned to drive prices higher. More so, the fact that the accumulation phase is associated with the bulls gaining control, the price pattern on the chart is flat.
Markup Phase: Bulls get enough traction to push the price above the upper limit of the range. This is a signal that the price has into the second stage and that a bullish price pattern is creating on the chart.
Distribution Phase: This is the third stage of the theory. The bears are planning to retake control of the market during this phase. At this point, the price action on the chart is flat, as it was during the Accumulation process. A sustained failure of price to create higher bottoms on the chart is one indication that the market is in the Distribution stage. Lower tops are developed as a result of the price action, indicating that the market is currently in a selloff.
Markdown Phase: Following the Distribution phase, the Markdown process performing as a downtrend begins. It implies that the bears have got sufficient financial power to move the market downward. The markdown is confirmed when the price breaks below the lower level of the horizontal distribution channel’s flat range on the chart.
Moreover, the AVAX is currently in the Accumulation Phase. This indicates that there will be more bearish days ahead.
Avalanche (AVAX) RSI
The below chart shows the relative strength index (RSI) of AVAX.
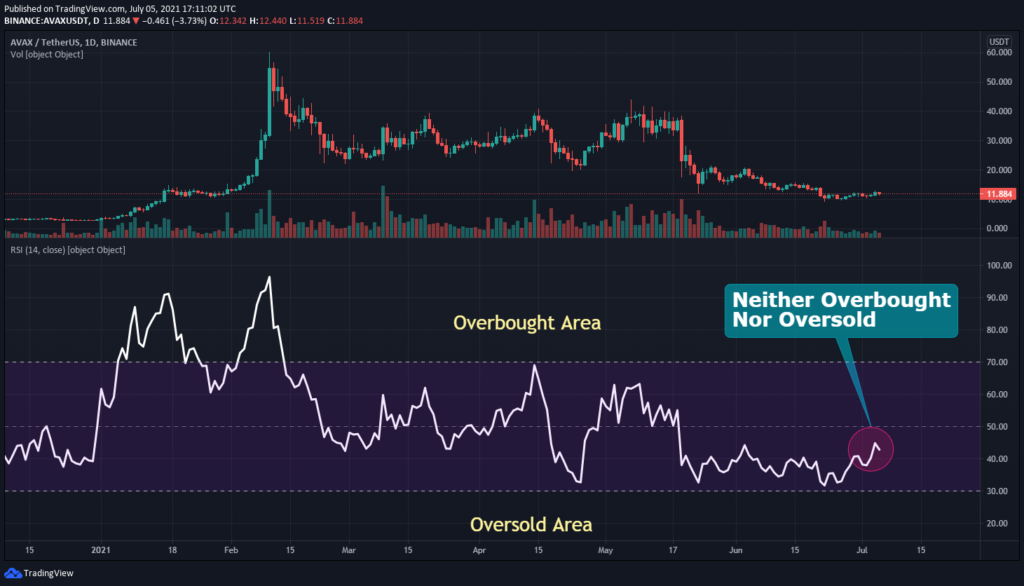
As shown in the below chart, RSI remains at 42. This shows that AVAX’s price is in a neither overbought nor oversold state. However, this shows that traders can trade fearlessly.
Avalanche (AVAX) RVOL
The below chart shows the Relative Volume of AVAX. RVOL is an indicator that represents to traders how the current trading volume has changed over a period of time compared to the past trading volume.

Notably, in the last week of June, it is found that the RVOL of AVAX observed is weaker. Currently, the RVOL of AVAX remains below the cutoff line which represents the weaker participants in the current trend.
Avalanche (AVAX) Moving Average
AVAX’s Moving Average (MA) is shown in the chart below. Moving Average is a part of technical analysis that supports traders to find trends.

In the 50 MA (Short-term), the price of the AVAX is in a bearish state, and it has not broken the 200 MA. However, it will completely go to a bearish state. Currently, the price of AVAX is trading below the 200 MA level so we can expect more bullish in the upcoming days.
Avalanche (AVAX) Price Comparison With Bitcoin
The below chart shows the price comparison between AVAX and BTC.
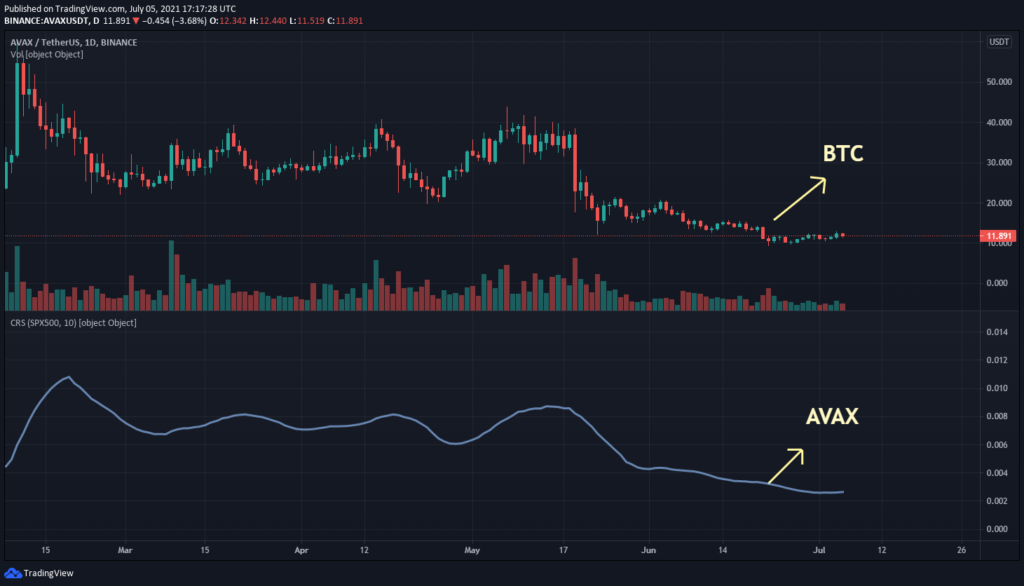
From the chart, we can identify the trend of the BTC and AVAX is moving at the same level as the trend. This indicates when the price of BTC increases or decreases, the price of AVAX also increases or decreases respectively.
Conclusion
With the ongoing developments and upgrades that are taking place within the AVAX platform. Avalanche has a great future ahead in this crypto market. However, AVAX can reach new heights.
Bullish AVAX price prediction 2021 is $15. As mentioned above, it may reach great heights, however reaching $30, if investors have decided that AVAX is a good investment in 2021.
FAQ
Avalanche is an umbrella project for launching decentralized finance (DeFi) applications, financial assets, trading, and other services.
AVAX is listed on many cryptocurrency exchanges that include Binance, OKEx, Huobi Global, and many more. It is present for trading against crypto-fiat coins, stablecoins, and other cryptocurrencies.
With the ongoing developments and upgrades inside the AVAX platform, it has a high possibility of reaching its ATH soon.
Disclaimer: The opinion expressed in this chart solely author’s. It does not interpreted as investment advice. TheNewsCrypto team encourages all to do their own research before investing.
Recommended for you


