- Onyxcoin traded within the $0.02809 range.
- XCN’s daily trading volume reached $137 million.
Asset prices are retreating to previous lows amid crypto market volatility. Among altcoins, Onyxcoin (XCN) has emerged as a standout performer early on. The asset has gained a modest 1.78%.
Onyxcoin’s upside correction triggered it to visit the $0.0305. Gradually, XCN slipped and traded at the lowest of $0.02686. The altcoin has broken through crucial resistance levels and with the next on the horizon, the asset has room for potential upside.
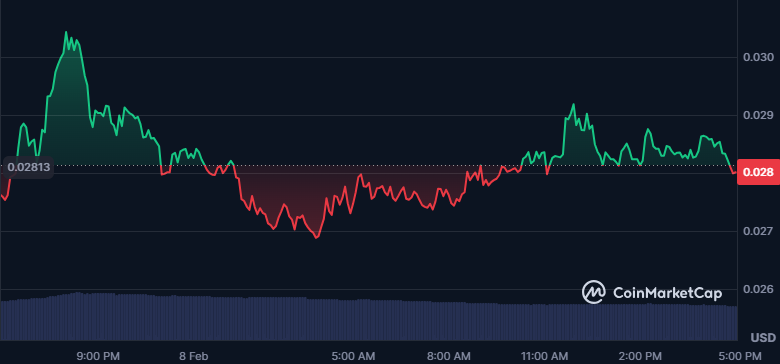
At the time of writing, XCN traded at $0.02809, with the market cap reaching $861 million. In the interim, the daily trading volume touches $137 million. Furthermore, the altcoin has lost over 13.41%, exposing its prolonged bearish momentum.
Can XCN Bounce Back from Recent Losses?
The four-hour technical analysis of XCN reports the overall negative outlook with the Moving Average Convergence Divergence (MACD) line and the signal line below the zero line. It indicates a strong bearish crossover with sellers in control.
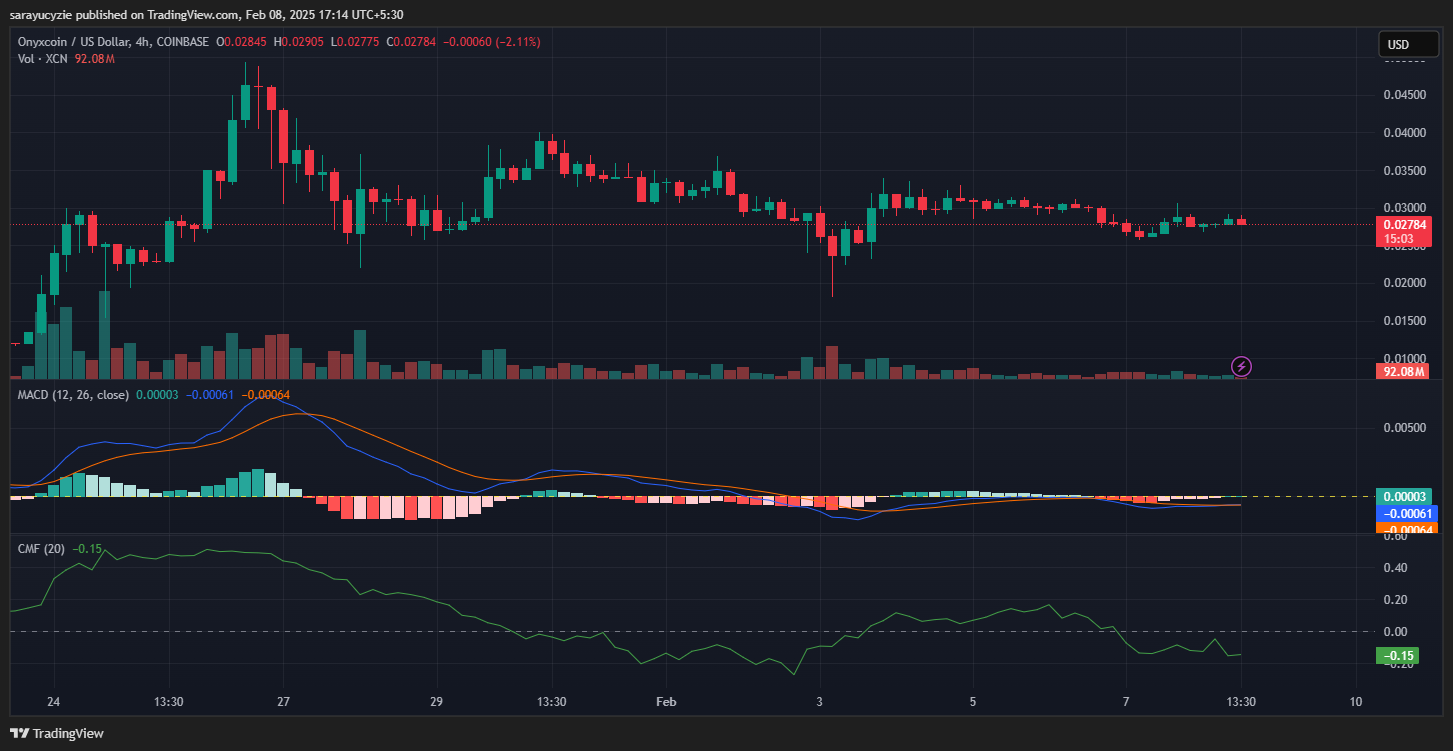
Besides, the Chaikin Money Flow (CMF) indicator at -0.15 suggests a negative money flow with solid selling pressure in the market, and that money is flowing out of the asset. Meanwhile, the asset’s trading volume has slipped by 16.14%.
The asset’s trading pattern is on the downside, and if the support at $0.02474 fails to hold, Onyxcoin could confront intense selling pressure and retrace to the $0.01981 mark. Extended bearish momentum could send the asset back to its prior lows.
In turn, if the upside correction unfolds, the Onyxcoin price could be poised to break through the critical $0.034 resistance barrier. The extended bullish momentum could kickstart a rally toward a high of $0.042 or above.
In addition, the 24-hour chart displays the short-term 9-day moving average below the long-term 21-day moving average. The daily relative strength index (RSI) positioned at 46.54 infers neither overbought nor oversold conditions.
Disclaimer: The opinion expressed in this article is solely the author’s. It does not represent any investment advice. TheNewsCrypto team encourages all to do their own research before investing.
Highlighted Crypto News