- The release of CPI data set off a bullish track for cryptocurrencies.
- Shiba Inu surged only 4% after the Shibarium Beta launch.
- As per CMC, Bitcoin attained its 9-month-high of $26,514.
Following the Fed’s CPI data release on Tuesday, the global crypto market is rebounding by displaying bullish rallies. Since the onset of 2023, memecoins and AI-based crypto tokens dominated the trending lists on Twitter and various aggregator feeds – CoinMarketCap and Coingecko. Significantly, Bitcoin and Ethereum reclaimed the ranks and are pinned on top.
Let us now analyze the price movement trend of the top 3 trending cryptocurrencies.
Bitcoin (BTC)
Post the fall of the US banking giants, Bitcoin hit the crypto headlines with its surprising bullish rally. After Tuesday’s CPI data release, BTC surged to hit the $26,000 mark. However, it is subjected to a series of retests.
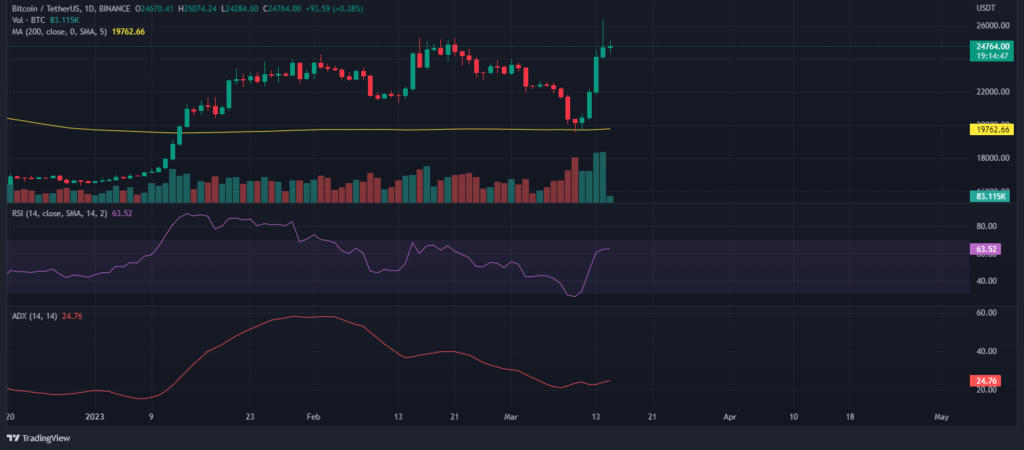
Since the beginning of this week, BTC laid daily green candles above the 200 moving average line (200 EMA). In this way, the dominant crypto coin sent bullish signals in the crypto market shortly. As per TradingView data, the relative strength index (RSI) of Bitcoin is 63.58, at the time of writing. This indicates that BTC is neither an overbought nor oversold state.
But the average directional index (ADX) of BTC declined to the range of 24.76, suggesting the possibility of a trend reversal. If the ADX line rises from the short decline, the current uptrend might bolster. Conversely, if it declines, the bullish momentum will weaken.
| 24H | 7D | Since the Start of 2023 |
| 1.36% | 11.89% | 49.4% |
Ethereum (ETH)
Following the rise of its top contender, Ethereum also transitioned to its bullish track. Ethereum has the updates of its Shanghai hard fork for this phase of the crypto market.
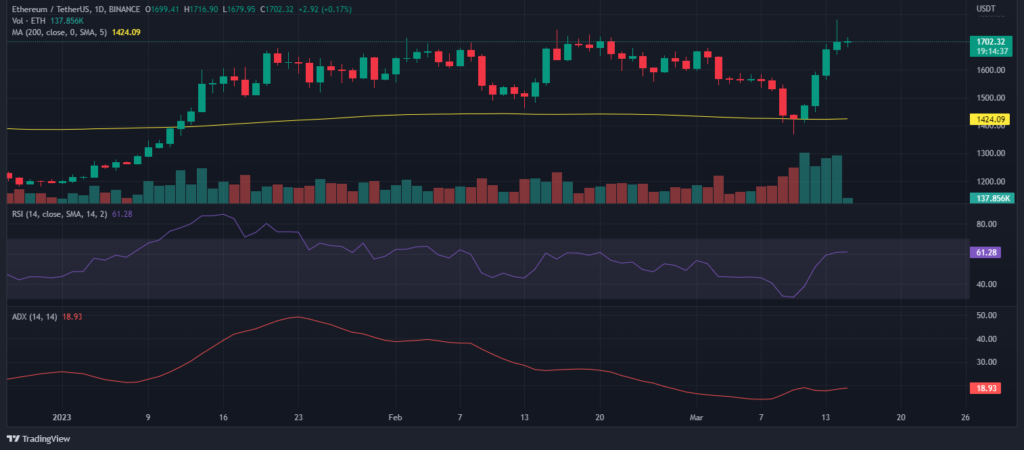
From the above chart, it can be inferred that ETH is in a bullish momentum since last weekend, as the price range lies above the 200MA. Also, at press time, ETH’s ADX is at 18.93 pointing out the chances of its bullish strength’s weakening. The asset’s RSI of 61.32 indicates that Ether is in neither an overbought nor oversold state, similar to BTC.
| 24H | 7D | Since the Start of 2023 |
| 1.31% | 9.35% | 42.41% |
Shiba Inu (SHIB)
Shiba Inu emerged as the most trending cryptocurrency of this crypto season with its Shibarium anticipation. The launch of its Shibarium Beta and SHIB Metaverse’s premier triggered the hype.
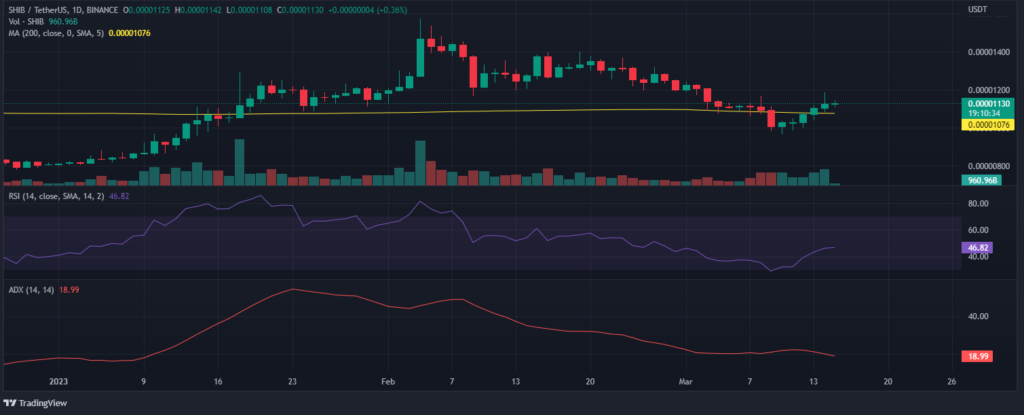
According to the data on the above chart, Shiba Inu (SHIB) is in an uptrend as its price hovered above the 200MA. On the contrary, at the time of writing, SHIB’s ADX was recorded in the range of 18.99. This suggested that the bullish trend of SHIB might weaken if the ADX continues sliding down. This probability of a trend reversal will be disproved if Shiba Inu’s ADX line rises above 25.
| 24H | 7D | Since the Start of 2023 |
| 1.98% | 3.70% | 39.58% |
Apart from these trending cryptocurrencies, certain coins exhibited remarkable surges. The crypto market sentiment is pacified now after the USDC recovered from its de-pegging. Moreover, the closure of prominent centralized banks, the Fed’s intervention, and the CPI release all contributed to the market’s recovery.
Recommended For You:
Disclaimer: The opinion expressed in this article are solely the author’s (based on research from sources). It does not represent any investment advice. TheNewsCrypto team encourages all to do their own research before investing.


