


In Terra (LUNA) Technical Analysis 2021, we use past statistics, price analysis, RSI, MA, and much other information about LUNA to analyze the future trend of the cryptocurrency.
Luna is the reserve currency of the Terra platform and has three main functions that are to retrieve transactions from Terra through staking, ensure the price stability of Terra stablecoins, and provide incentives for the platform’s blockchain validators. The Terra protocol runs on a Proof of Stake (PoS) blockchain, where miners have to use their Luna to conduct mining transactions.
Terra (LUNA) Current Market Status
According to CoinGecko, the LUNA price is trading at $16.05 with a 24-hour trading volume of $471,139,567, at the time of writing. However, LUNA has decreased by 7% in the last 24 hours.
In addition, LUNA has a circulating supply of 411,872,768 LUNA coins. Currently, LUNA trades in Binance, OKEx, Bitfinex, and Huobi.
Terra (LUNA) Technical Analysis 2021
Terra (LUNA) holds the 23rd position on CoinGecko right now. The recent development and upgrades might push LUNA to reach new heights. Now, let’s deep dive into the LUNA technical analysis 2021. The daily time frame chart of Terra (LUNA) is shown below.
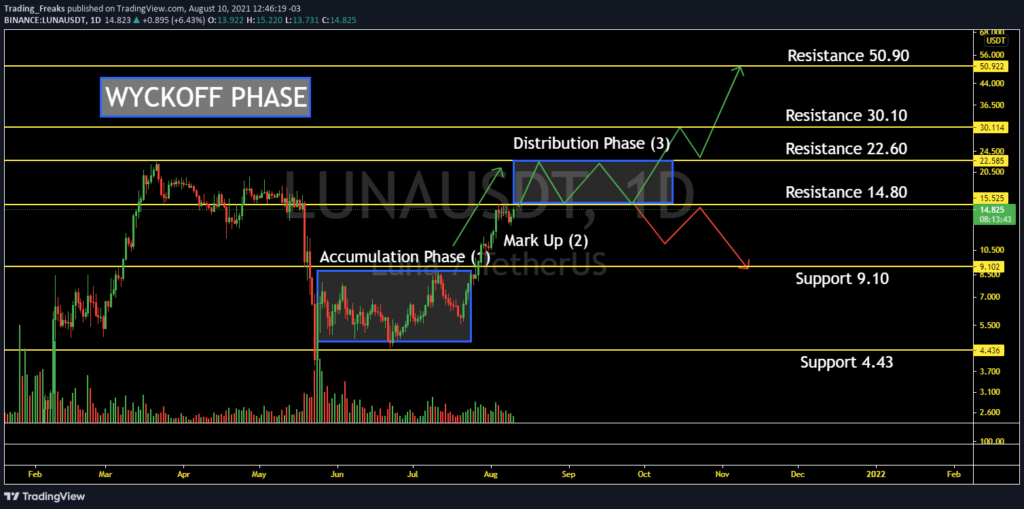
In Wyckoff’s theory, the price cycle of trading instruments includes four stages: accumulation, markup, distribution, and markdown.
Accumulation Phase: The accumulation process is displayed in the chart in the form of a price range. In addition, the bulls are gradually expanding, but they can still push up prices. The price pattern on the chart of LUNA is flat.
Markup Phase: The bulls have enough power to push prices above the high end of the range. This indicates that the price is in the second phase and a bullish price pattern is being created on the chart.
Distribution Phase: This is the third level of theory. The bear plan is now to regain control of the market. The price is currently flat on the chart, as in the accumulation process. The formation of higher and lower points in the chart indicates that the market is in the Distribution stage. The lower profit margin is caused by price changes, which indicates that the market is currently in a selloff.
Markdown Phase: After the Distribution phase, a price reduction process begins, just like a downward trend, which means that the bears have enough financial strength to pull the market down. When the price breaks through the lower level of the flat range of the horizontal distribution channel on the chart, a markdown will be confirmed.
More so, LUNA is currently in the distribution phase, which indicates that they have more bearish days and it may be possible to enter into the markdown phase.
Terra (LUNA) RSI
The below chart shows the relative strength index (RSI) of LUNA.

As shown in the above chart, RSI remains at 71.58. This shows that LUNA’s price is in an overbought state. This shows that traders have to trade carefully, however, major price reversal could take place.
Terra (LUNA) RVOL
The below chart shows the Relative Volume of LUNA. It is an indicator that indicates to traders how the current trading volume has changed over a period of time compared to the previous trading volume.
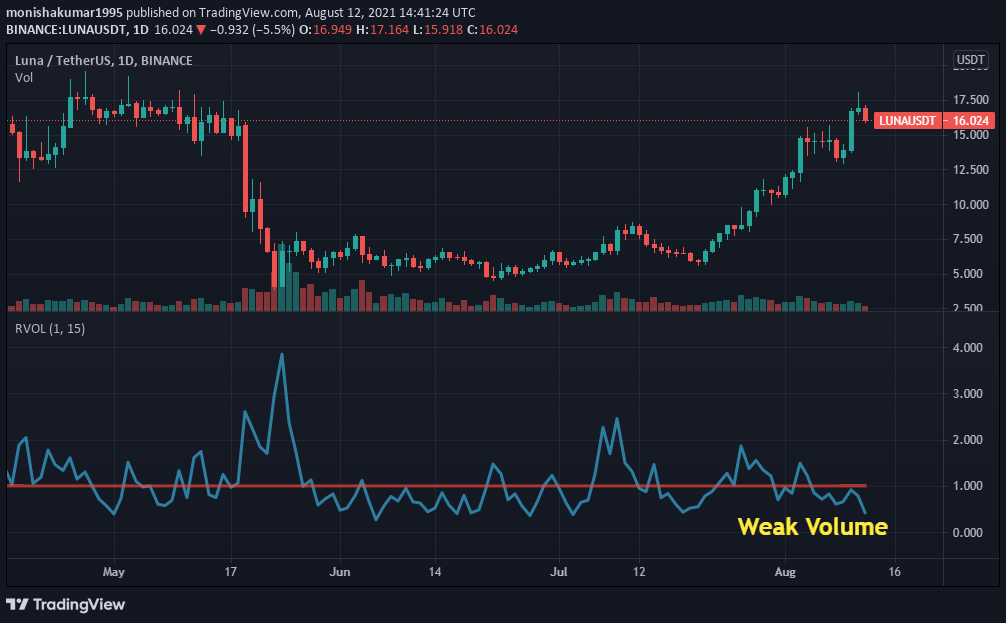
Currently, the RVOL of LUNA lies below the cutoff line which represents the weaker participants in the current trend.
Terra (LUNA) Moving Average
LUNA’s Moving Average (MA) is shown in the chart below. MA supports traders to find trends.

Currently, LUNA is in a bullish state. However, LUNA price is above 50 MA (short-term), and it has a high chance of moving higher. Furthermore, the LUNA price is above 50 MA and 200 MA (long-term), so it is completely in a bullish state. Moreover, there is also a possibility of Trend reversal at any time.
Terra (LUNA) Price Comparison With Bitcoin
The below chart shows the price comparison between LUNA and BTC.
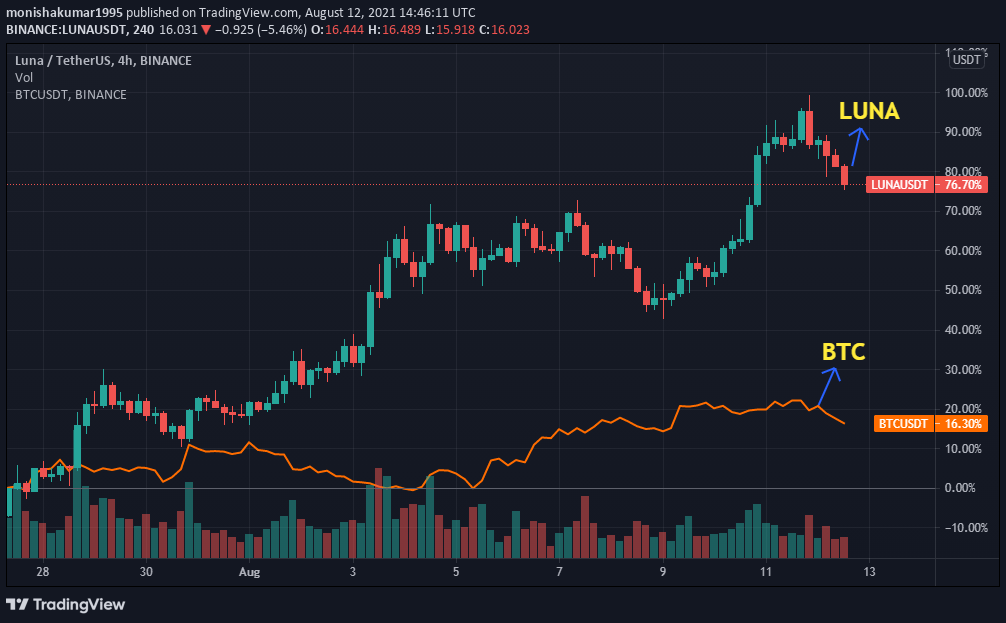
From the chart, we can identify the trend of the BTC and LUNA is moving at the same level as the trend. This indicates when the price of BTC increases or decreases, the price of LUNA also increases or decreases respectively.
Conclusion
With the ongoing developments and upgrades that are taking place within the LUNA platform. Terra has a great future ahead in this crypto market. However, LUNA can reach new heights.
Bullish LUNA price prediction 2021 is $22.36. As mentioned above, it may reach great heights, however reaching $50.9 is also possible, if investors have decided that LUNA is a good investment in 2021.
FAQ
LUNA is a blockchain protocol that uses stablecoins linked to fiat currencies to provide stable prices for the global payment system. Its native coin is Terra.
LUNA is listed on many cryptocurrency exchanges that include Binance, OKEx, Bitfinex and Huobi.
With the ongoing developments and upgrades within the LUNA platform, it has the high possibility of reaching its ATH soon.
Disclaimer: The opinion expressed in this chart solely author’s. It is not interpreted as investment advice. TheNewsCrypto team encourages all to do their own research before investing.
Recommended for You