
In SushiSwap (SUSHI) Technical Analysis 2021, we use past statistics, price analysis, RVOL, MA, and much other information about SUSHI to analyze the future trend of the cryptocurrency.
SushiSwap (SUSHI) is an example of an automated market maker (AMM). AMM is a decentralized exchange that is becoming more and more popular with cryptocurrency users and uses smart contracts to create a market for any pair of tokens. It was launched in September 2020 as AMM, a branch of Uniswap. AMM has become synonymous with the prosperity of the Decentralized Finance (DeFi) movement and related DeFi token businesses.
It’s aims to diversify the AMM market and add additional features that Uniswap did not have before, such as providing higher rewards to network members through internal SUSHI tokens.
SushiSwap (SUSHI) Current Market Status
According to CoinGecko, the SUSHI price is trading at $8.06 with a 24-hour trading volume of $198,655,422, at the time of writing. However, SUSHI has dropped by 6.8% in the last 24 hours.
In addition, SUSHI has a circulating supply of 192,789,255 SUSHI coins. Currently, SUSHI trades in Binance, OKEx, Tokocrypto, FTX, and Huobi Global.
SushiSwap (SUSHI) Technical Analysis 2021
SushiSwap (SUSHI) holds the 66th position on CoinGecko right now. The recent development and upgrades might push SUSHI to reach new heights. Now, let’s deep dive into the SUSHI technical analysis 2021. The daily time frame chart of SushiSwap (SUSHI) is shown below.
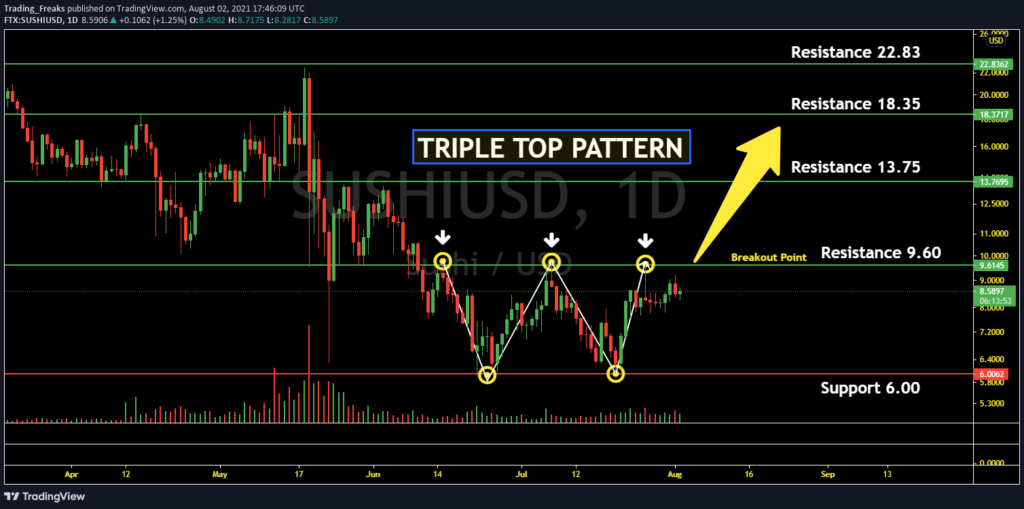
A triple top is a bearish chart pattern. It is simple, defined by three different peaks formed at roughly the same level in the market. This pattern is a special form of the head and shoulders pattern. Just that the three peaks top around the same price levels the same way the double top does.
The first peak on this chart occurred when the market trended for a period of time when the price fell again. The price returns to the same level as the first high, but buyers will not be able to gain enough momentum to drag the price down through resistance. The third peak is also formed in the same way.
If they all reach the same price level, the price may fall or exceed the previous high. No matter what happens, each peak should have a decreasing volume.
Currently, SUSHI is trading at $8.5. After this, SUSHI may continue to fall or rise according to the direction of the breakout. With this pattern, SUSHI might reach the resistance level at $22.83 soon. If the trend reverses, then the price of SUSHI may fall to $6.
SushiSwap (SUSHI) RSI
The below chart shows the relative strength index (RSI) of SUSHI.
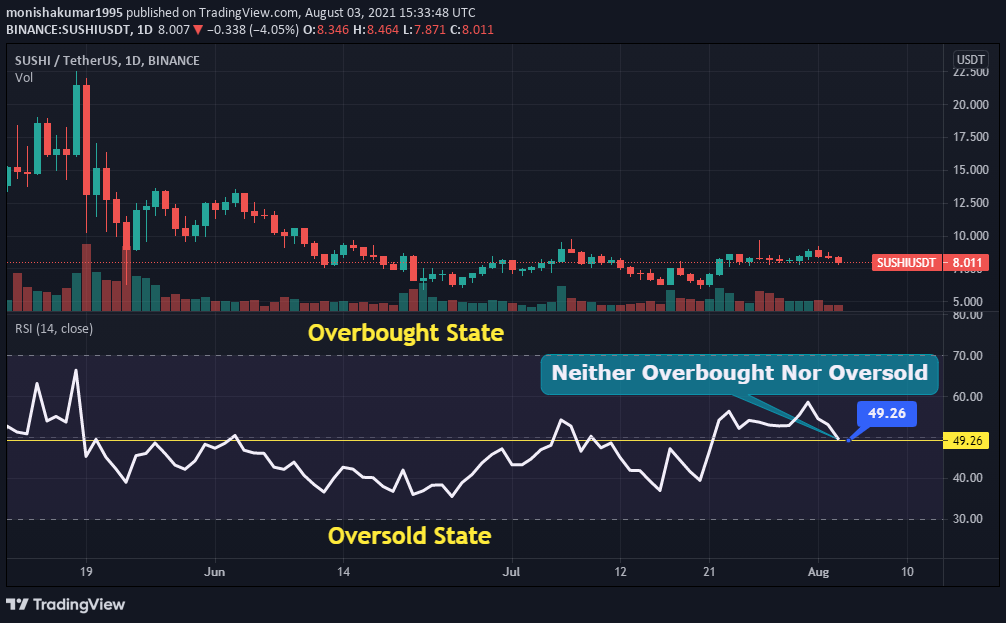
As shown in the above chart, RSI remains at 49.2. This shows that SUSHI’s price is in a neither overbought state nor oversold state. However, this shows that traders can trade fearlessly.
SushiSwap (SUSHI) RVOL
The below chart shows the Relative Volume of SUSHI. It is an indicator that indicates to traders how the current trading volume has changed over a period of time compared to the previous trading volume.

Currently, the RVOL of SUSHI lies below the cutoff line which represents the weaker participants in the current trend.
SushiSwap (SUSHI) Moving Average
SUSHI’s Moving Average (MA) is shown in the chart below. MA supports traders to find trends.
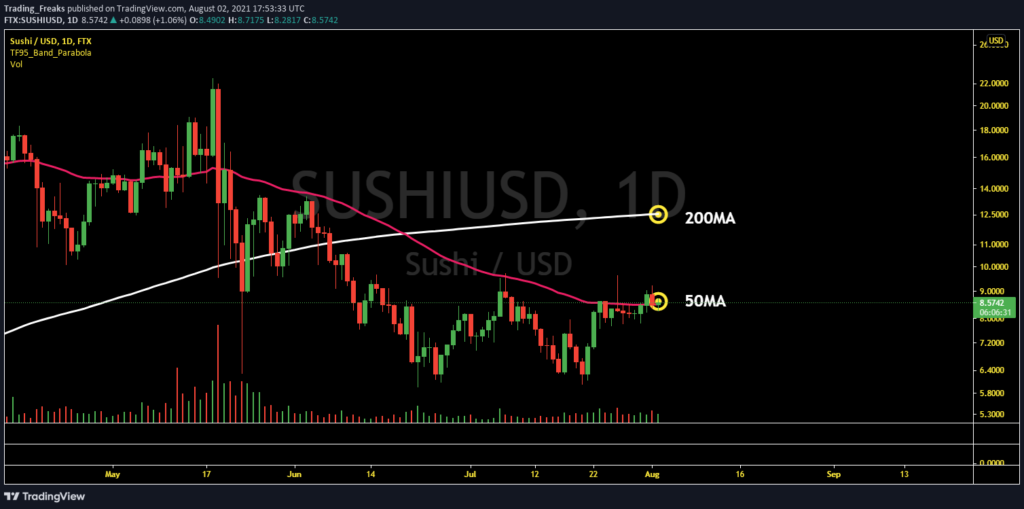
Currently, SUSHI is in a bearish state. However, SUSHI price touches 50 MA (short-term), and it has a high chance of moving above 50-MA level. Possibly, SUSHI can also move above 200 MA (long-term) soon.
Once it moves above 50 MA and 200 MA level, it completely goes to a bullish state. Moreover, there is a high possibility of a Trend reversal at any time.
SushiSwap (SUSHI) Price Comparison With Bitcoin
The below chart shows the price comparison between SUSHI and BTC.
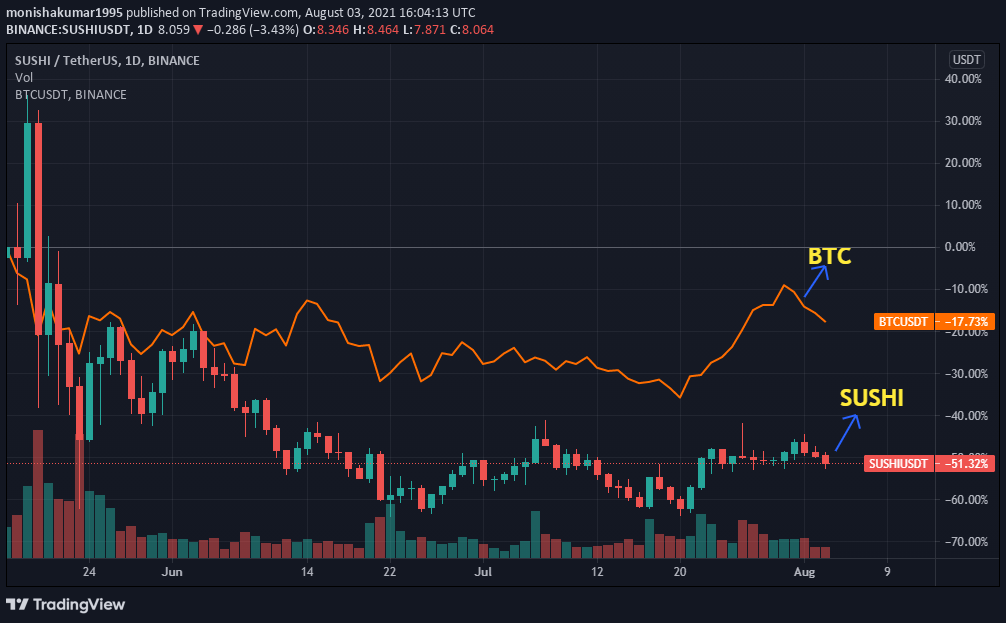
From the chart, we can identify the trend of the BTC and SUSHI is moving at the same level as the trend. This indicates when the price of BTC increases or decreases, the price of SUSHI also increases or decreases respectively.
Conclusion
With the ongoing developments and upgrades that are taking place within the SUSHI platform. SushiSwap has a great future ahead in this crypto market. However, SUSHI can reach new heights.
Bullish SUSHI price prediction 2021 is $13.75. As mentioned above, it may reach great heights, however reaching $22.8 is also possible, if investors have decided that SUSHI is a good investment in 2021.
FAQ
SUSHI is a governance token that enables community governance over the Sushi ecosystem, which means that SUSHI holders can use their tokens to vote on platform proposals to promote ecosystem initiatives. It’s native coin is SushiSwap.
SUSHI is listed on many cryptocurrency exchanges that include Binance, OKEx, Tokocrypto, FTX, and Huobi Global.
With the ongoing developments and upgrades within the SUSHI platform, it has the high possibility of reaching its ATH soon.
Disclaimer: The opinion expressed in this chart solely author’s. It is not interpreted as investment advice. TheNewsCrypto team encourages all to do their own research before investing.
Recommended for You