- Bullish SHR price prediction ranges from $0.05 to $0.09.
- SHR price might also reach $0.2 soon.
- SHR bearish market price prediction for 2021 is $0.02
In ShareToken (SHR) price prediction 2021, we use statistics, price patterns, RSI, and much other information about SHR to analyze the future movement of the cryptocurrency.
ShareToken is a digital utility token which is utilized to make payments for sharing services over industries and geographies on the ShareRing platform, that includes the ShareRing application, ShareRing shop and each user’s ShareRing ID.
ShareRing is a blockchain-based open-source platform which makes use of distributed ledger technology and a dual token mechanism. As per the developers and founders of the ShareRing platform, the current service sharing economy is incredibly fragmented and multi-faceted, which could be overwhelming for users. The use of ShareToken on the ShareRing platform overcomes this problem by providing a single decentralized marketplace and crypto asset that helps users securely access services over the world and pay for them.
In 2019, the founders of the platform and its respective crypto turned their focus to the travel industry and created TravelRing which is the first B2B consumer-first example of which is possible using the ShareRing platform. Besides being used to pay for transaction fees on the ShareRing network, SHR tokens could also be staked to earn rewards called flowbacks.
As per CoinGecko, the SHR price is trading at $0.0371 with a 24-hour trading volume of $951,677, at the time of writing. ShareRing has decreased by 2.2% in the last 24 hours.
Moreover, ShareRing has a circulating supply of 2,418,778,639 SHR. Currently, SHR trades in cryptocurrency exchanges such as KuCoin, BitMart, Bithumb Global, 1inch Exchange, and ProBit Global.
ShareRing (SHR) Price Prediction 2021
ShareRing (SHR) holds the 441th position on CoinGecko right now. ShareRing price prediction 2021 explained below with a daily time frame.

Descending channel trend, designed between downward sloping parallel lines. Lower highs and lower lows characterize this price pattern. Channel trends are used commonly to confirm trends and identify breakouts and reversals. Descending channel trend shows an absolute downtrend. Traders can swing trade between the pattern’s support and resistance levels or trade in the directions of a breakout.
In the daily time frame chart, if the price of the SHR breaks the resistance level of $0.05, it will reach the target of $0.09. Else, if the price of the SHR breakout the support level of $0.02 means it will fall to the next support level at $0.01. So, the trend of the SHR is based on the breakout.
SHR Support and Resistance Level
The below chart shows the support and resistance level of SHR.

From the above daily time frames, it is clear the following are the resistance and support level of SHR.
- Resistance Level 1 – $0.05
- Resistance Level 2 – $0.09
- Support Level 1 – $0.02
- Support Level 2 – $0.01
The charts show that SHR has performed a bullish trend over the past month. If this trend continues, SHR might run along with the bulls overtaking its resistance level at $0.09.
Conversely, if the investors turn against the crypto, the price of SHR might plummet to almost $0.01, a bearish signal.
ShareRing (SHR) Average Directional Index (ADX)
Now let’s look at the average directional index (ADX) of SHR. Generally, the Average Direction Index (ADX) helps crypto traders identify the strength of a trend, instead of its actual direction. It can be used to check whether the market is changing or a new trend is initiating. It is associated with the Directional Movement Index (DMI) and basically includes the ADX line.
The range of the oscillator is from 0 to 100. A high value represents a strong trend, and a low value shows a weak trend. It is often combined with directional indicators.
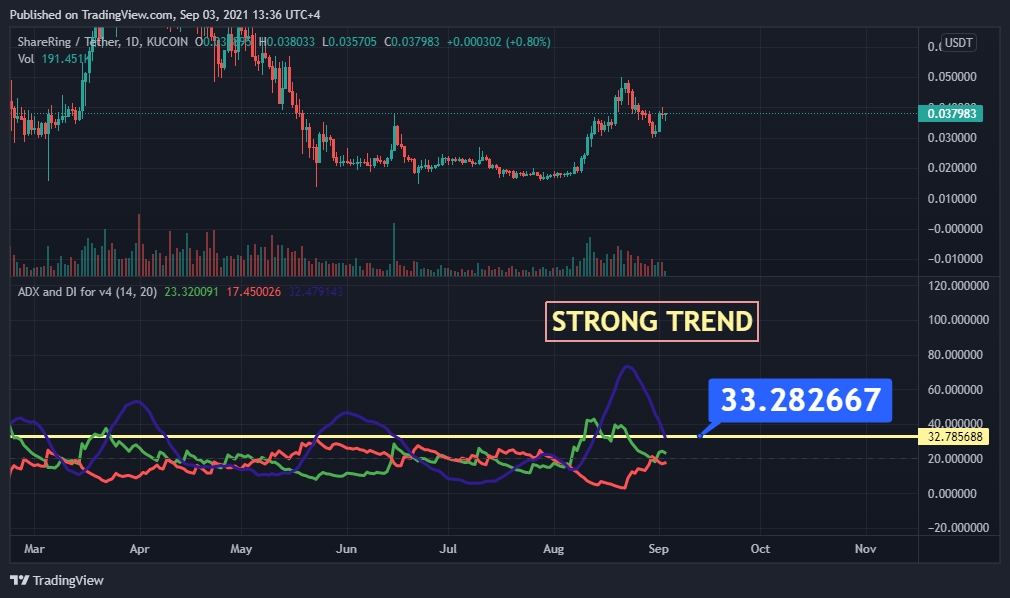
The above chart shows the ADX of SHR stays above the range of 21, so it indicates a weak trend.
Conclusion
The SHR is one of the cryptos that keeps its ground against the bearish market. Furthermore, our long-term SHR price prediction 2021 is bullish. It has a huge possibility of overtaking its current all-time-high (ATH) of $0.09856 this year. This will only happen if it breaks many past psychological resistances.
Furthermore, with the ongoing developments and upgrades within the SHR ecosystem, it could experience a great future ahead in 2021. It may reach $0.05 soon and it might even reach high heights, however reaching $0.09, if investors have planned that SHR is a good investment in 2021.
Disclaimer: The opinion expressed in this chart solely author’s. It does not interpreted as investment advice. TheNewsCrypto team encourages all to do their own research before investing.
Recommended for You