In PancakeSwap (CAKE) Technical Analysis 2021, we use past statistics, price analysis, RSI, RVOL, and much other information about PancakeSwap to analyze the future movement of the cryptocurrency.
PancakeSwap is an automated market maker (AMM) which is a decentralized finance (DeFi) app that enables users to exchange tokens, providing liquidity through farming and gaining fees in return.
Moreover, the project is launched in September 2020. In addition, it is a decentralized exchange for swapping BEP20 tokens on Binance Smart Chain. More so, the PancakeSwap uses an automated market maker model where users trade over a liquidity pool. However, these pools are filled by users who deposit their funds into the pool and receive liquidity provider (LP) tokens in return.
In addition, these tokens can later be utilized to reclaim their share of the pool, as well as a portion of the trading fees. However, these LP tokens are called FLIP. PancakeSwap also enables users to farm additional tokens like CAKE and SYRUP. On the farm, users can deposit LP tokens and gain rewards with CAKE.
PancakeSwap (CAKE) Current Market Status
According to CoinMarketCap, the PancakeSwap price is trading at $14.6 with a 24-hour trading volume of $384,383,476, at the time of writing. However, PancakeSwap has decreased by 9.74% in the last 24 hours.
In addition, PancakeSwap has a circulating supply of 192,546,541.94 CAKE. Currently, PancakeSwap trades in Binance, FTX, BitWell, HitBTC, and Bitcoin.com Exchange.
PancakeSwap (CAKE) Technical Analysis 2021
PancakeSwap (CAKE) holds the 31st position on CoinMarketCap right now. The recent development and upgrades might push PancakeSwap to reach new heights. Now, let’s deep dive into the PancakeSwap technical analysis 2021. The daily time frame chart of PancakeSwap (CAKE) is shown below.
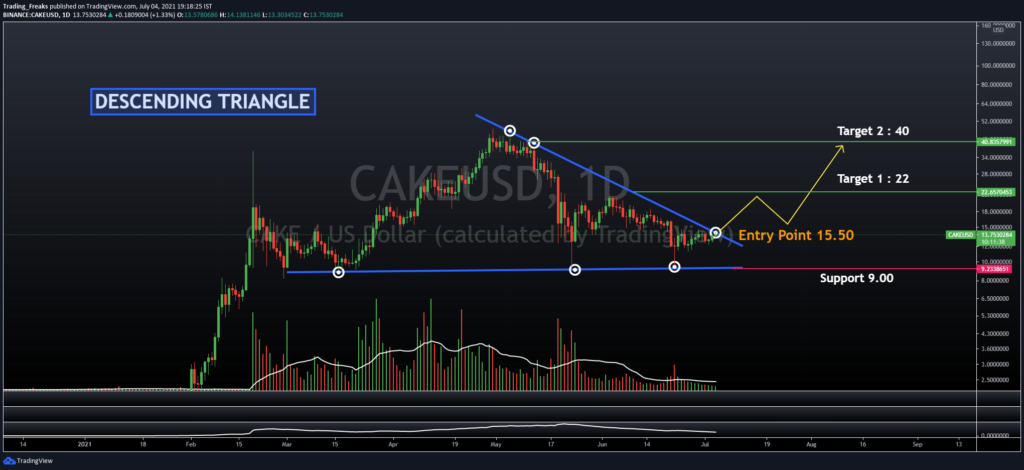
The above chart shows the Descending Triangle pattern in the daily time frame. The above chart shows the descending triangle pattern of CAKE. This is an important indicator since CAKE has been showing bearish over the past month. Consequently, the descending triangle pattern hints that CAKE will finally go bearish.
In the daily time frame chart, it is possible for the PancakeSwap to reach $22 if the bull trend continues. Orelse, if the price of the PancakeSwap breaks the support level of $9. So, the trend of the PancakeSwap is based on the breakout.
PancakeSwap (CAKE) RSI
The below chart shows the relative strength index (RSI) of PancakeSwap.
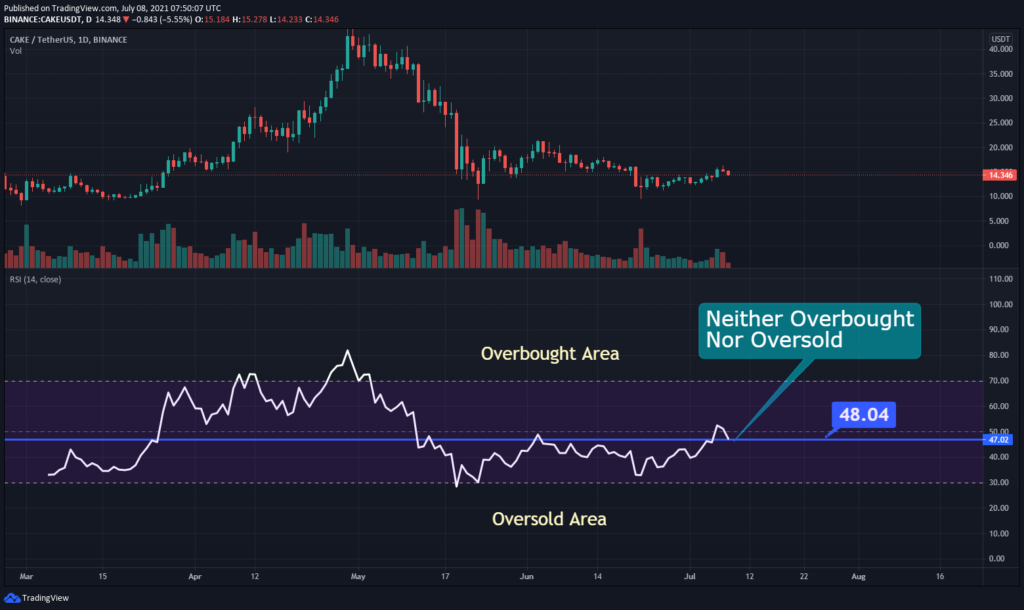
As shown in the below chart, RSI remains at 48. This shows that PancakeSwap’s price is in a neither overbought nor oversold state. However, this shows that traders can trade fearlessly.
PancakeSwap (CAKE) RVOL
The below chart shows the Relative Volume of PancakeSwap. RVOL is an indicator that represents to traders how the current trading volume has changed over a period of time compared to the past trading volume.
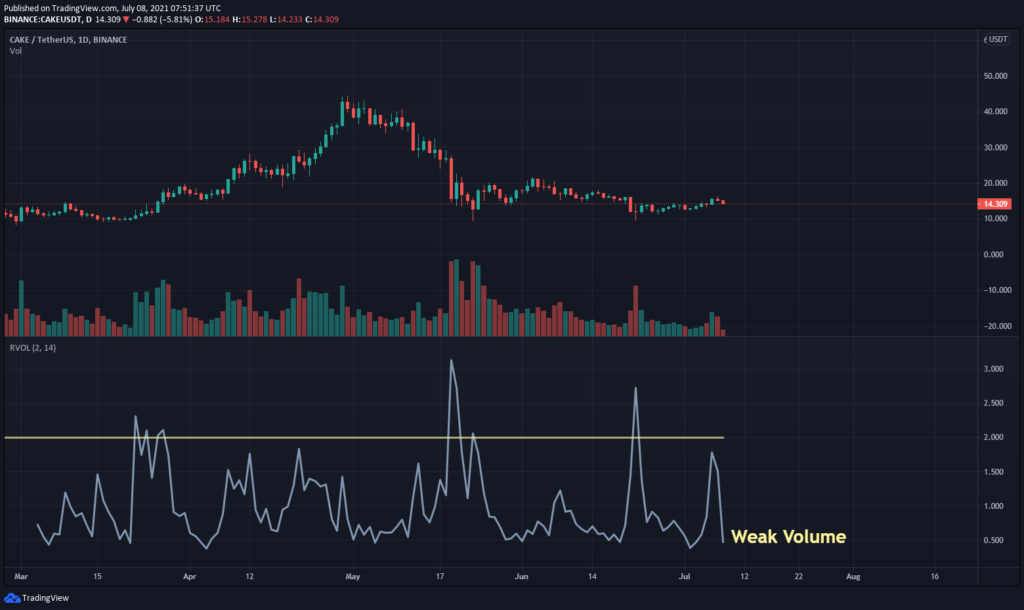
Currently, the RVOL of PancakeSwap remains below the cutoff line which represents the weaker participants in the current trend.
PancakeSwap (CAKE) Moving Average
PancakeSwap’s Moving Average (MA) is shown in the chart below. Moving Average is a part of technical analysis that supports traders to find trends.
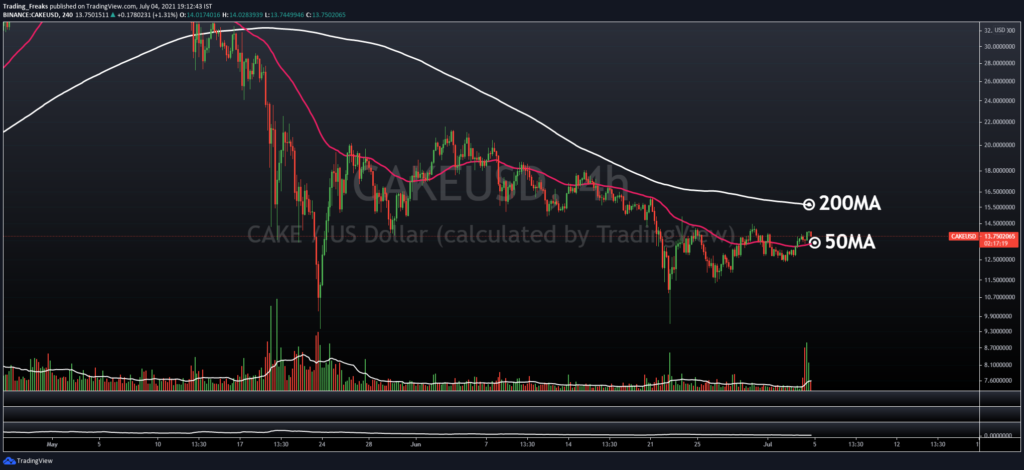
In the 50 MA (Short-term), the price of the CAKE is in a bullish state, and it stays above 50 MA. However, it will completely go to a bullish state. Currently, the price of CAKE is trading near the 200 MA level so we can expect a more bullish trend in upcoming days.
PancakeSwap (CAKE) Price Comparison With Bitcoin
The below chart shows the price comparison between PancakeSwap and BTC.
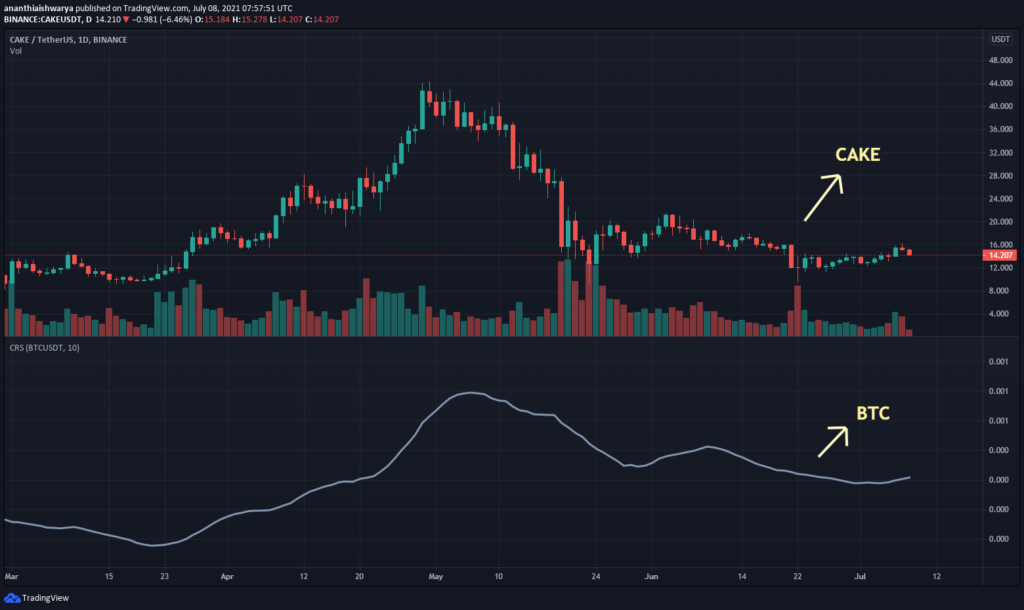
From the chart we can identify the trend of the Bitcoin (BTC) and PancakeSwap (CAKE) is moving at the same level as the trend. This indicates when the price of BTC increases or decreases, the price of PancakeSwap also increases or decreases respectively.
Conclusion
With the ongoing developments and upgrades that are taking place within the PancakeSwap platform. PancakeSwap has a great future ahead in this crypto market. However, PancakeSwap can reach new heights.
Bullish PancakeSwap price prediction 2021 is $22. As mentioned above, it may reach great heights, however reaching $40, if investors have decided that PancakeSwap is a good investment in 2021.
FAQ
PancakeSwap is an automated market maker (AMM) which is a decentralized finance (DeFi) app that enables users to exchange tokens, providing liquidity through farming and gaining fees in return.
PancakeSwap is listed on many cryptocurrency exchanges that include Binance, FTX, BitWell, HitBTC, and Bitcoin.com Exchange. It is present for trading against crypto fiat coins, stablecoins, and other cryptocurrencies.
With the ongoing developments and upgrades inside the PancakeSwap platform, it has the high possibility of reaching its ATH soon.
Disclaimer: The opinion expressed in this chart solely author’s. It does not interpreted as investment advice. TheNewsCrypto team encourages all to do their own research before investing.
Recommended for you