- Bullish Orchid price prediction ranges from $0.5 to $0.81.
- Orchid prices might also reach $1 soon.
- OXT bearish market price prediction for 2021 is $0.29.
In Orchid (OXT) price prediction 2021, we use statistics, price patterns, RSI, and much other information about OXT to analyze the future movement of the cryptocurrency.
OXT is the native token of Orchid. The token is a crypto-based virtual private network (VPN). Moreover, the token was Launched in December 2019. Orchid explains itself as the world’s first incentivized, peer-to-peer privacy network.
More so, the token aim is to overcome internet freedom limitations by utilizing digital asset payments to enable anyone to purchase bandwidth from any participating provider. Even more, this can be done utilizing so-called probabilistic nanopayments, which takes place using OXT, an ERC-20 standard token on Ethereum.
Regular payments to providers take place off-chain, enabling Orchid to avoid issues with congestion and gas fees on the Ethereum network. Let us see about the Orchid price prediction 2021.
Current Market Status of Orchid (OXT)
According to CoinMarketCap, the Orchid price is trading at $0.4389 with a 24-hour trading volume of $114,409,729, at the time of writing. Moreover, Orchid has increased by 11.08% in the last 24 hours.
Currently, Orchid trades in cryptocurrency exchanges such as Binance, OKEx, Upbit, Huobi Global, and BiONE.
Orchid (OXT) Price Prediction 2021
Orchid (OXT) holds the 162nd position on CoinGecko right now. Orchid price prediction 2021 explained below with a daily time frame.

The descending triangle is most commonly seen during downtrends and is often interpreted as a bearish signal. The descending triangle pattern is the reverse of the ascending triangle pattern.
As the price continues to make lower lows, descending triangles indicate to investors and traders that buyers are less aggressive than sellers. Contrary to popular belief, a descending triangle can be bullish or bearish. A regular descending triangle pattern, traditionally regarded as a bearish chart pattern. A descending triangle pattern, on the other hand, can be bullish.
Currently, OXT is trading at $0.45. After this, OXT may continue to fall or rise according to the direction of the breakout. With this pattern, OXT might reach the resistance level at $1.02 soon. If the trend reverses, then the price of OXT may fall to $0.2.
Orchid (OXT) Support and Resistance Level
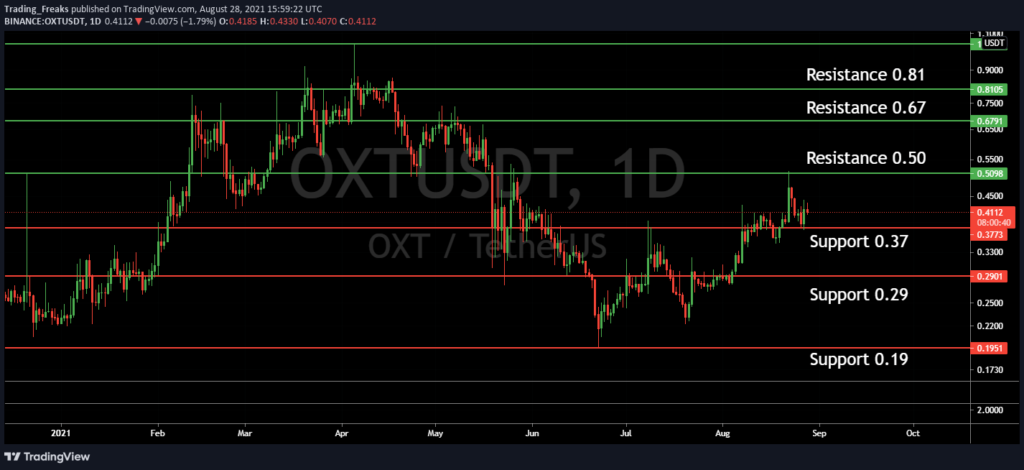
The OXTow chart shows the support and resistance level of Orchid (OXT).

From the above chart, it is considered that the following are the resistance and support levels of Orchid (OXT).
- Resistance Level 1 – $0.5
- Resistance Level 2 – $0.67
- Next resistance level – $0.81
- Support Level 1 – $0.37
- Support Level 2 – $0.29
- Next support level – $0.19
The chart depicts the bullish performance of Orchid over the previous month. However, this trend will continue to reach a resistance level at $0.81 soon. Even more, if the trend reversed then Orchid might fall to $0.19 presenting a bearish signal.
Orchid (OXT) Average Directional Index (ADX)
Let us now look at Orchid’s Average Directional Index (ADX). In particular, the ADX assists traders in determining the strength of a trend rather than its direction. It can also be used to determine whether the market is changing or if a new trend is beginning. It is, however, linked to the Directional Movement Index (DMI).
Moreover, the oscillator has a range of 0 to 100. In addition, a high value represents a strong trend, while a low value represents a weak trend. Furthermore, it is frequently combined with directional indicators.

The above chart represents the ADX of Orchid. Currently, Orchid lies in the range at 43.57, so it indicates a strong trend. This shows that the price of ADX can go bullish in the future.
Conclusion
Orchid is one of the cryptos which is great for long-term investment. In addition, Orchid price prediction is bullish for a short-term. It has a good chance of reaching $0.67 within the end of this year. However, this will only happen if many previous psychological barriers broken.
Furthermore, with the advancements and upgrades on the Orchid ecosystem, the performance of Orchid would rise reaching $0.81 very soon. But, it might also reach $1 if the investors believe that Orchid is a good investment in 2021.
Disclaimer: The opinion expressed in this chart solely author’s. It does not interpreted as investment advice. TheNewsCrypto team encourages all to do their own research before investing.
Recommended for You


