
In Monetha (MTH) Technical Analysis 2021, we use past statistics, price patterns, RSI, and much other information about MTH to analyze the future movement of the cryptocurrency.
Monetha is a blockchain company that is developing a universal, transferable, and immutable trust and reputation system as well as a payment solution. It was established in January 2017 by three cryptocurrency enthusiasts. Moreover, MTH is an ERC20 Ethereum token.
Monetha (MTH) Current Market Status
According to CoinGecko, the current price of Monetha is $0.023300 with a 24-hour trading volume of $228,886, at the time of writing. Furthermore, it has a total market cap of $9,375,906 besides, MTH is down 1.19% in the last 24 hours.
The current circulating supply of MTH coins is 402,400,000. Monetha trades on top exchanges like Binance, HitBTC, Coin DCX, and Mercatox.
Monetha Technical Analysis 2021
The recent development and upgrades might push Monetha (MTH) to reach new heights. Now, let’s deep dive into the Monetha technical analysis 2021. The weekly time frame chart of Monetha (MTH) is shown below.
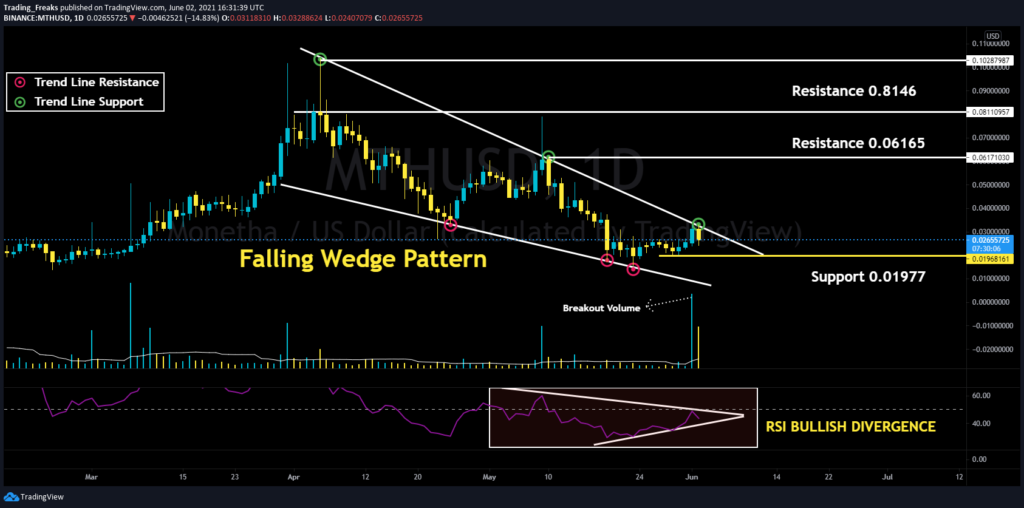
The above chart shows the Falling Wedge Pattern of MTH. The Falling Wedge is a bullish pattern that starts wide at the top and narrows as prices fall. As the trend high and trend low converge, the price action forms a cone that slopes downward.
Monetha (MTH) RSI, MACD, and MA
The below chart shows the Moving Average Convergence/Divergence (MACD) of MTH. Notably, the MACD (blue) made a crossover and stayed just above the signal indicator (orange line). This means that cryptocurrency traders can still expect more bullish days ahead.
In contrast, if the MACD begins to move below the signal indicator and performs a bearish crossover. Then the crypto has a high possibility of reaching new lows.
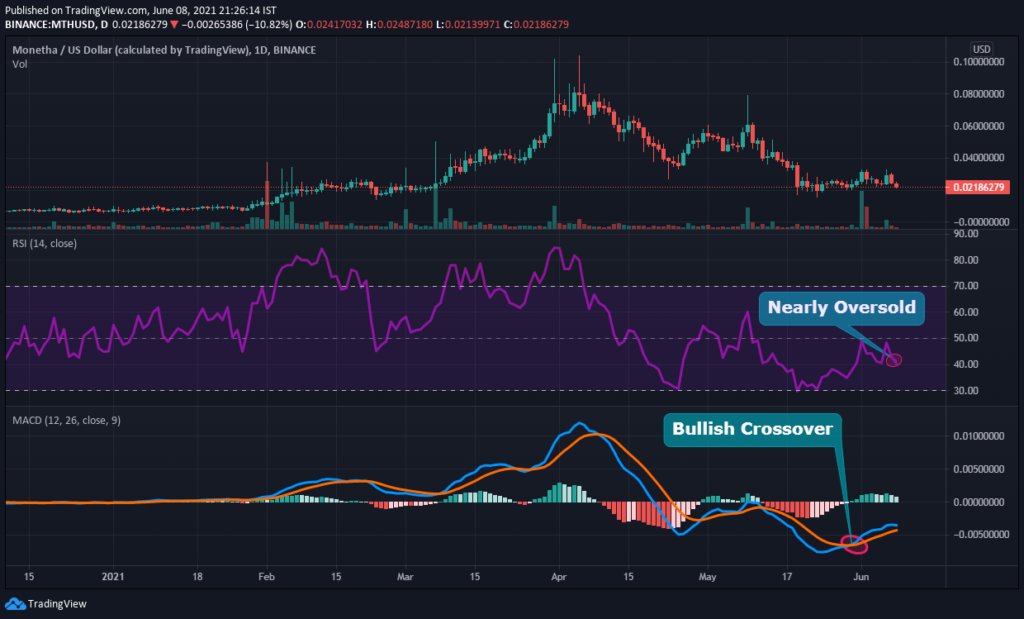
Now let’s look at the relative strength index (RSI) of MTH. As shown in the chart above, the RSI remains at level 40. This shows that MTH’s price is in a nearly oversold state. However, this gives confidence for the traders to trade without any fear.
Monetha’s Moving Average (MA) is shown in the chart below. Moreover, MA is a part of technical analysis that helps traders to recognize trends.
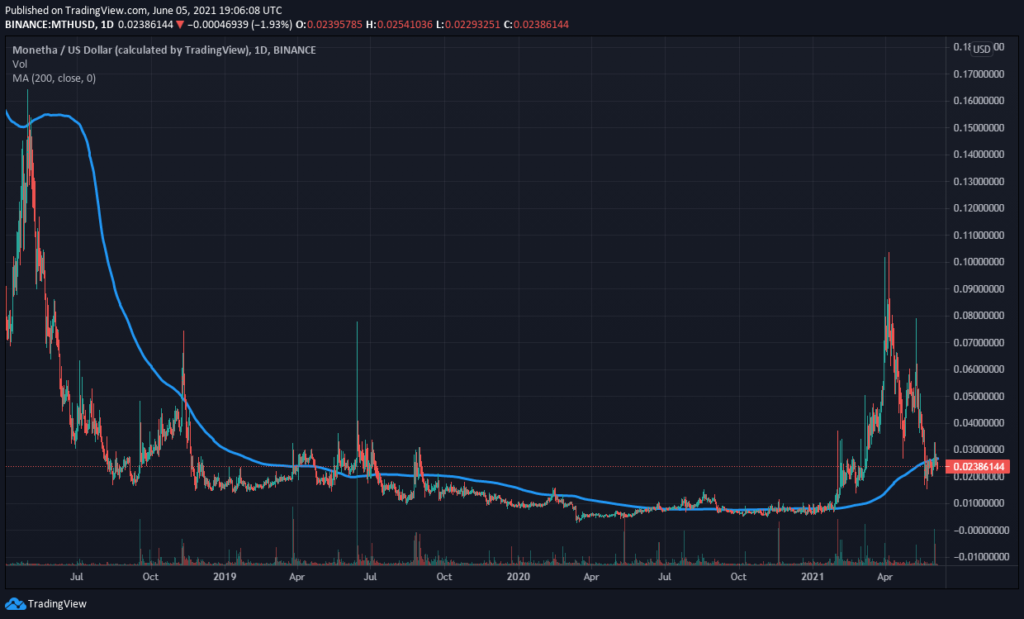
From the beginning of 2021, it is clear that the MTH price has shown many bullish patterns. Furthermore, taking all these into account, MTH could have a competitive market in 2021.
Conclusion
With the ongoing developments and upgrades that are taking place within the MTH platform. The cryptocurrency MTH has a fantastic future ahead in this crypto market. However, it is possible to see MTH reaching new heights.
Bullish MTH price prediction may rise to $0.5 in future.
FAQ
MTH is available on top cryptocurrency exchanges like Binance, HitBTC, CoinDCX, and Mercatox.
The MTH platform, with its recent advancements and updates, has a good chance of reaching its ATH soon.
Monetha is a decentralized payment solution that tackles all problems. It uses Ethereum blockchain network and smart contract technology to provide merchants with convenient payment solutions.
Disclaimer: The opinion expressed in this chart solely author’s. It does not interpreted as investment advice. TheNewsCrypto team encourages all to do their own research before investing.
Recommended for You