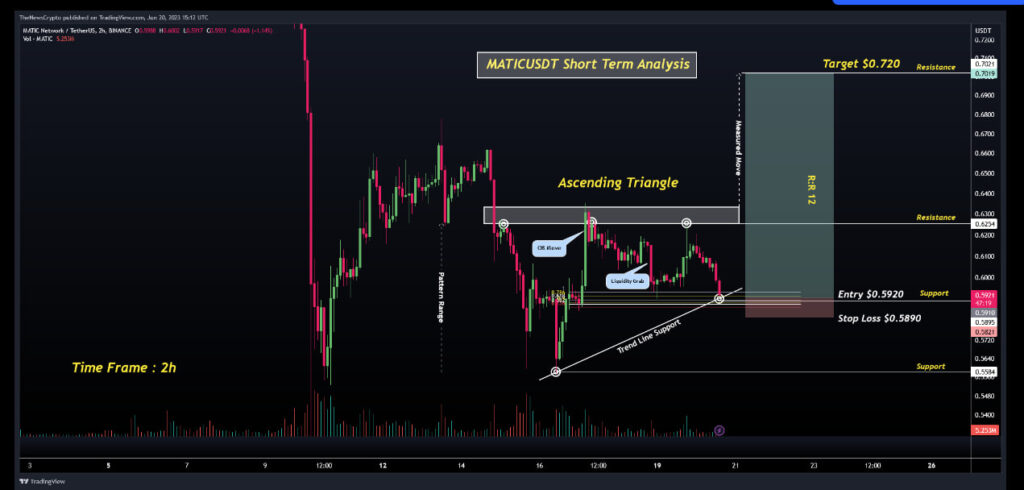
- Matic currently displays an intriguing Ascending Triangle Pattern.
- Traders eye a target price of $0.72 for Matic.
MATIC token currently displaying an intriguing technical pattern known as the Ascending Triangle Pattern on the daily time frame.
More so, this pattern has captured the attention of traders and investors as it suggests a potential bullish breakout in the near future. In addition, the price action is nearing the support zone within the pattern, indicating a critical juncture where market dynamics could shift. Added to this, traders are closely monitoring this setup, eagerly anticipating the breakout and the potential trading opportunities it may present.
Moreover, the Ascending Triangle Pattern is characterized through a series of higher lows, formed by an upward-sloping support trendline, while the resistance level remains relatively flat. In addition, this pattern signifies a period of consolidation, where buying pressure gradually increases and sellers struggle to push the price lower. All-in-all, as the price approaches the support zone, the potential for a breakout becomes more apparent, with traders keen to capitalize on the anticipated bullish momentum.
In this trade setup, the Smart Money Move concept is applied, aligning with the actions of institutional or well-informed market participants. By selecting the entry area at the support level, traders aim to enter at a strategic point that offers a favorable risk-to-reward ratio. More so, this approach not only enhances the potential trading opportunity but also helps to reduce downside risk.
With the Ascending Triangle Pattern forming on MATICUSDT and the price nearing the support zone, traders are eagerly positioning themselves to take advantage of a potential bullish breakout. Even more, by closely monitoring the price action, traders can seek confirmation of the breakout and execute their trading strategies accordingly. Notably, the target and stop loss levels are set strategically to manage risk and optimize potential profits. As always, traders should conduct their own analysis, adapt to changing market conditions, and exercise proper risk management techniques to navigate the dynamic cryptocurrency market successfully.
According to CoinMarketCap, the Matic is trading at $0.6 with a 24-hour trading volume of $247,789,490, at the time of writing.

Matic Price Analysis: Trade Setup
Entry: To capitalize on the potential breakout, it is recommended to enter a long position at $0.5920, the support level within the Ascending Triangle Pattern. This entry point is strategically chosen based on the Smart Money Move concept, which aligns with the actions of institutional or informed market participants. By entering at the support level, traders aim to benefit from the potential bullish momentum that may follow the breakout.
Target: The target for this trade setup is set at $0.720, offering a significant upside potential from the entry level. This target represents the expected price movement after the breakout from the Ascending Triangle Pattern. Traders should monitor the price action closely and adjust their targets based on individual risk tolerance and market conditions.
Stop Loss: To effectively manage risk, it is essential to place a stop loss at $0.5890. This stop loss level is strategically positioned below the entry point and the support zone, aiming to limit potential downside risks. By implementing a stop loss, traders can protect their capital in case the breakout fails and the price retraces.
The formation of an Ascending Triangle Pattern on MATICUSDT suggests a potential bullish breakout on the horizon. By strategically entering a long position at the support level of $0.5920, traders can position themselves to potentially benefit from the anticipated bullish momentum. Furthermore, with a target set at $0.720 and a stop loss at $0.5890, traders can effectively manage risk while aiming for a favorable upside potential. More so, with any trading decision, conducting thorough analysis, monitoring market conditions, and adjusting strategies accordingly remain crucial for successful trading.
Disclaimer: Any information contained in this article is not proposed to be and doesn’t constitute financial advice, investment advice, trading advice, or any other advice. The NewsCrypto is not responsible to anyone for any decision made or action taken in conjunction with the information and/or statements in this article.


