
- Ethereum price slips into the $2.3K range, with a brief 1.52% spike.
- ETH hits a 4-month high in network growth with 126,210 new wallets.
Altcoins have shown mixed signals this week, with Ethereum, the largest altcoin, grappling to hold its ground. Its price remains caught between crucial support and resistance levels, recently dropping below $2,400.
Notably, over the past 24 hours, despite price fluctuations, ETH witnessed a moderate spike of 1.52%. At the press time, ETH traded at $2,351 with a market cap of $282 billion.
Over the day, Ethereum recorded the lowest price at $2,274, and the highest at $2,379. The market observed a liquidation of $27.23 million worth of ETH during this timeframe, as per CoinGlass. Meanwhile, the daily trading volume of ETH has increased by 19.10% to $15 billion, according to CoinMarketCap data.
On the other hand, it is important to note that Ethereum has reached a four-month high in network growth, with 126,210 new wallets created last Sunday. Despite this, the market sentiment of ETH continues to reflect fear as the fear and greed index stays at 37. Investors and traders are concerned that the ongoing bearish phase could be prolonged if Ethereum (ETH) fails to rebound.
Will ETH’s Downside Pressure Continue?
On the monthly chart, Ethereum’s price has formed a series of lows, and the price has plunged 12.60%. An upside price correction was expected amid the volatility. However, in the past week, the asset has continued to slide down, noting a 6% drop. ETH fumbled from $2.5K to $2.1K.
The current bearish pace could trigger ETH to collapse to the $2.2K level. If the momentum persists, further pullback can be expected below the $2K level. On the other hand, a rebound above the current price could bring a retest, and ETH might jump toward $2,424.
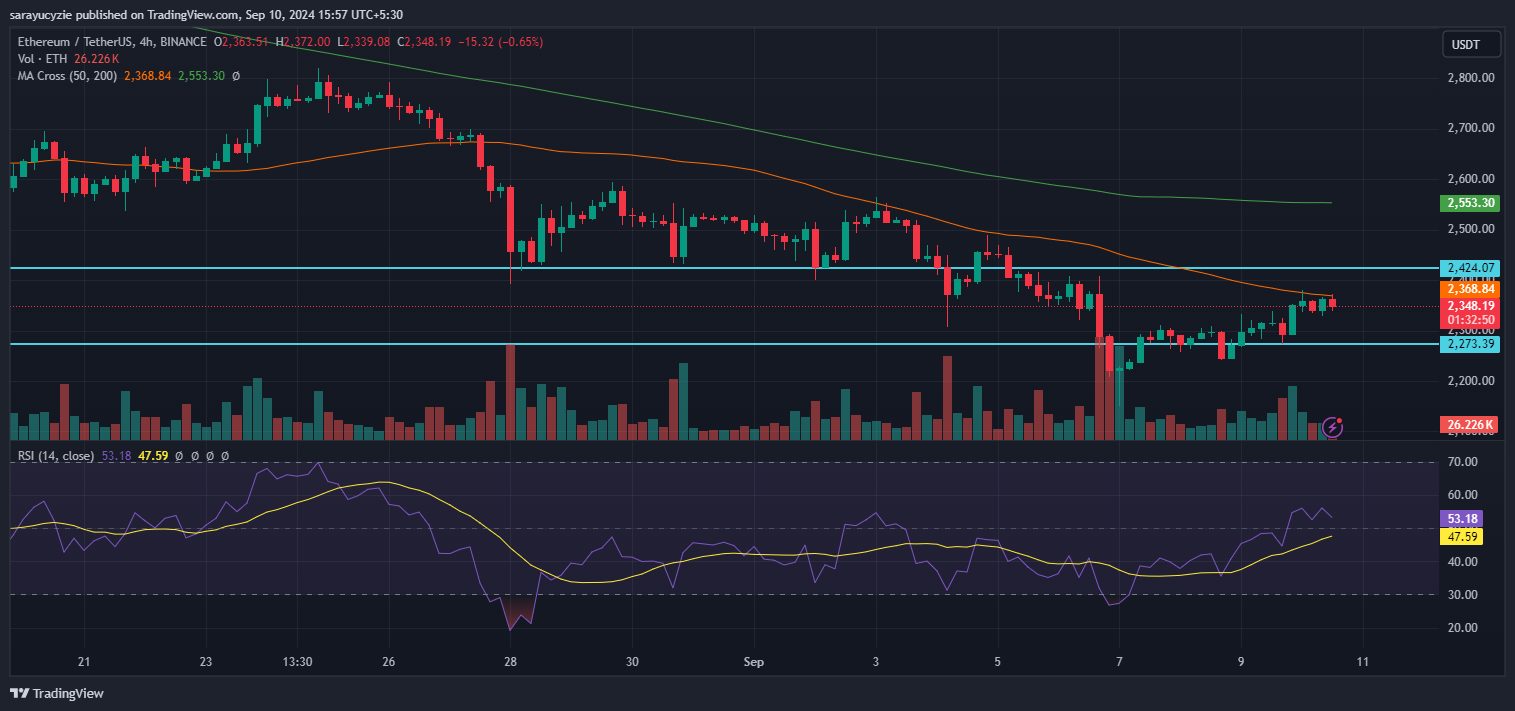
At the time of analysis, the daily Relative Strength Index (RSI) is positioned at 53.18, in the neutral zone. The RSI momentum and the short-term 50 and long-term 200 moving averages noted at $2,368 and $2,553 respectively, suggest that the current price momentum for ETH is bearish.
Highlighted Crypto News