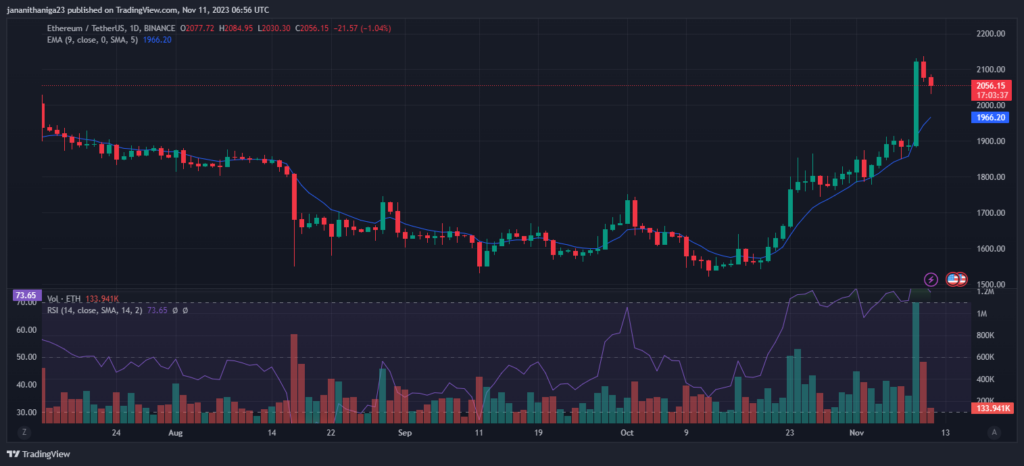
- Ethereum trading volume is down 47% in 24 hours.
- The daily RSI stands at 73, indicating an overbought condition.
Ethereum has been a focal point of discussions in the cryptocurrency world this week, making significant strides in its price. It surged above $2,000, reaching a six-month high of $2,136 yesterday, marking a 13% increase in the past seven days. Several factors appear to have contributed to this surge, mainly BlackRock‘s filing for a Spot Ethereum ETF with the Delaware Department of State and broader macroeconomic influences.
However, the recent price movement has also introduced a higher level of volatility. In the last twenty hours, Ethereum witnessed a 3% decline in its price and a substantial 47% drop in trading volume. This downturn coincides with a regrettable incident that occurred a few hours ago when a Poloniex hacker managed to steal approximately $118 million worth of assets on both the Ethereum and Tron blockchains.
Reflecting on the previous day, data shows a surge in demand for block space on the Ethereum network, causing transaction fees to rise significantly. Median gas prices reached as high as 270 gwei, reaching levels last seen in June 2022, highlighting the congestion on the network.
Despite the price volatility and the excitement around the ETF announcement, Ethereum remains a hot topic. Social media platforms are buzzing with 52% positive sentiment surrounding Ethereum, and both transaction volume and circulation have seen notable increases in the past twenty hours.
Furthermore, Ethereum’s market value has seen a remarkable 38% increase in just four weeks, driven by the network’s robust growth. Notably, the number of micro addresses holding less than 0.1 ETH has exceeded 100,000 wallets for the first time, and even the 0.1–10 ETH and 10,000+ ETH tiers are showing signs of growth.
Will the Ethereum Bulls Reign?
An analysis of recent movements suggests a bullish trajectory on the daily chart, with the 9-day exponential moving average (EMA) positioned below the current trading price at $1,965. However, the daily relative strength index (RSI) indicates an overbought condition, standing at 73.

If the price successfully surpasses the $2,123 resistance level, it is likely to test the $2,732 level. Conversely, a drop below $2,000 would likely lead to testing the $1,907 support level, with further declines possibly taking the price down to $1,856.


