
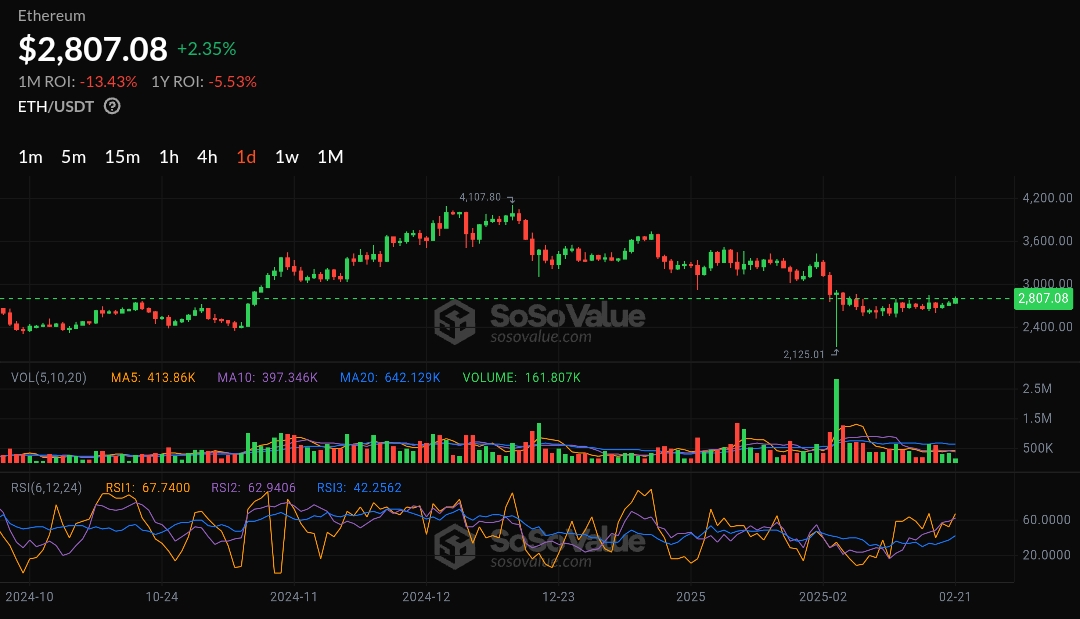
- Ethereum is currently trading around $2,802, with immediate support at $2,750 and resistance near $2,850.
- Ethereum ETFs saw mixed flows on February 20, 2025, with net outflows of $13.1M.
Ethereum is tightening in a narrow price band. The range—$2,650 to $2,750—has held firm for over two weeks. A decisive breakout is coming, but the direction remains uncertain. Technical analysis indicates a symmetrical triangle pattern on Ethereum’s 4-hour chart, suggesting potential for an upward movement. A successful breakout could target the $3,000 to $3,100 range.
Despite muted price action, smart money is accumulating. Ethereum gradually recovered as it traded around $16 billion trading volume in 24 hours. Long-term hodler are utilizing this opportunity as a buy moment.
The current Ethereum price set-up usually precedes a decisive move, as the $2,820 level might be a catalyst for the next bull activity.

Key Levels: Breakout or Breakdown?
Ethereum faces strong resistance at $2,800, a level that has repeatedly halted upward movement. If it breaks through, the next hurdle is the 200-day moving average at $2,930. Clearing this level could propel ETH to $3,055.
Zooming in, the M30 supply zone has historically acted as a resistance area, leading to price rejections. This suggests that sellers are active in this region, potentially preventing upward movement. Conversely, the M15 demand zone around the $2,600 level has shown strong buyer interest, providing support during price dips. This indicates that buyers are willing to enter the market at this price point, potentially preventing further declines.
A bearish scenario forming as the BTC/Ethereum MVRV Momentum Oscillator is turning negative. By market history, this shift has always preceded sharp ETH corrections, as seen in May 2022 and September 2023. If ETH loses $2,600, it may plummet to $2,400 or lower.
Technical signals are conflicting. The Relative Strength Index (RSI) is currently around 50, indicating neutral momentum. The Money Flow Index (MFI) is approximately 57, suggesting a slight leaning towards buying pressure.
Also, institutional activity shows mixed signals with inflows and outflows throughout the week. US Ethereum ETFs recorded net outflows of $13.1 million on February 20, 2025. This divergence indicates varying levels of institutional confidence.
Despite the Ethereum price running low, Analyst Carl Moon feels bullish, he figures that the Token is forming a potential signal for $3,005.
A bullish scenario is also possible. Ethereum is at a crossroads. If bulls crack $2,850, a rally past $3,000 is likely. But failure to hold $2,600 could lead to a deeper drop. Traders should watch for confirmation before making moves.