
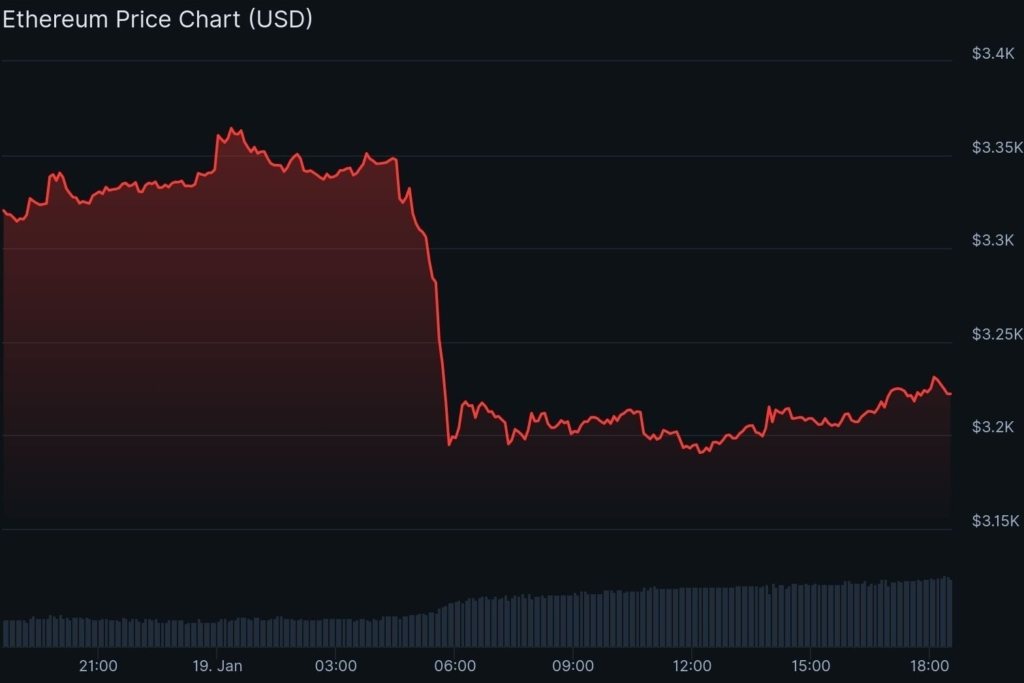
- Ethereum has slipped and is trading around $3.2K.
- ETH’s daily trading volume has rocketed by 143%.
As the bearish stretch across the market continues, all the major crypto assets are found in the red zone, with signs of exhaustion. The largest asset, Bitcoin (BTC), is hovering at $93K, while the largest altcoin, Ethereum (ETH), has registered a 2.91% slump. In the morning hours, the asset was trading at a high of $3,367.17.
With the potential bears taking control of the ETH market, the price has plummeted to a bottom of $3,181.67. At the time of writing, Ethereum traded at around $3,222.34, and the daily trading volume has rocketed by 143%, settling at $28.14 billion. Also, the market has observed a liquidation of $156.31 million worth of ETH.
Besides, an analyst chart displays $3,085 as a key support level for Ethereum, aligned with an ascending trendline. If it holds above this mark, it keeps the bullish structure intact and increases the chances of a breakout toward the $3.4K zone. A break below this level weakens the momentum and delays any upside move.
Ethereum’s downside trajectory pulls the price back to the $3,118 support. The emergence of the death cross might likely accelerate the loss even further to former lows. Assuming an upside move by ETH, the price might rise to the resistance at the $3.3K zone. Upon breaking this level, a potential recovery could loom, with the force of a golden cross.
Ethereum’s Technical Chart Signals a Bearish Bias
ETH’s Moving Average Convergence Divergence (MACD) line is below the zero line, which indicates that the downtrend is dominant and it trades below its longer-term average. The signal line remains above the zero line, showing the broader trend has not fully turned bearish, hinting at a weakening price trend.
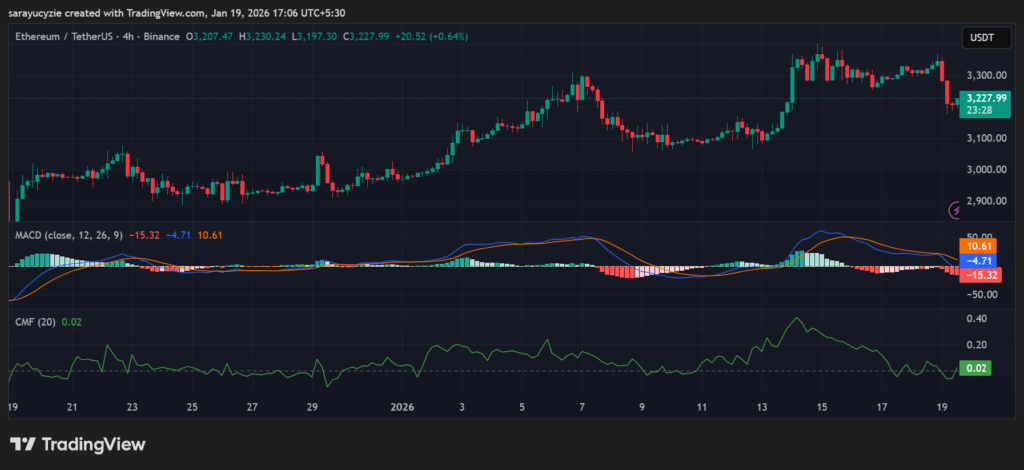
Moreover, the Chaikin Money Flow (CMF) indicator at 0.02 sits briefly above the zero line, suggesting very mild buying pressure in the Ethereum market. Notably, the capital inflows slightly exceed the outflows, but the momentum is weak and not decisive, reflecting consolidation rather than a strong trend.
Ethereum’s Bull Bear Power (BBP) value, staying at -125.81, signals strong bearish dominance. The sellers are firmly in control, with the price trading below, giving a hint of an intense continuation of the downside unless momentum shifts. Furthermore, the daily Relative Strength Index (RSI) found at 41.37 is resting below the neutral 50 level, implying bearish momentum. As ETH is not oversold, it leaves room for further short-term consolidation.
Top Updated Crypto News
Solana (SOL) Tumbles 6%: Can Bulls Halt the Freefall, or Do Bears Truly Hold the Reins?