
- Dogecoin price is trading within the $0.078 mark.
- DOGE’s selling pressure is currently increasing.
The bearish pressure has triggered the digital assets to lose momentum, pushing them into the red zone. Among them, the dog-themed Dogecoin (DOGE) has modestly dropped by over 1.03%. Notably, there is a chance of the price falling further from here, a clear downside bias.
Currently, the meme coin price is trading at $0.07893, and it might slip and reach 0.07851 first, then likely move below $0.078 as the next key level. Any weak bounce toward the $0.07938 level could face rejection, with bearish engulfing patterns continuing to appear on lower timeframes.
If price reclaims ground and climbs above $0.080, the market may try to flip into the neutral zone. An additional bullish push toward 0.08049 and 0.081 would gradually set an upside reversal, with strong momentum.
DOGE opened the day, trading at around a high of $0.0803, and with the bearish pressure, the price has dropped toward a lower range of $0.0783. Significantly, the daily trading volume has decreased by over 18.41% to $509.73 million.
Is Dogecoin Headed for More Losses?
The Moving Average Convergence Divergence line is below the signal line, and both are stationed below the zero line. This hints at a strong bearish momentum in the DOGE market. Technically, the selling pressure is currently increasing. The downside momentum outweighs buying interest and the risk of further weakness remaining elevated.
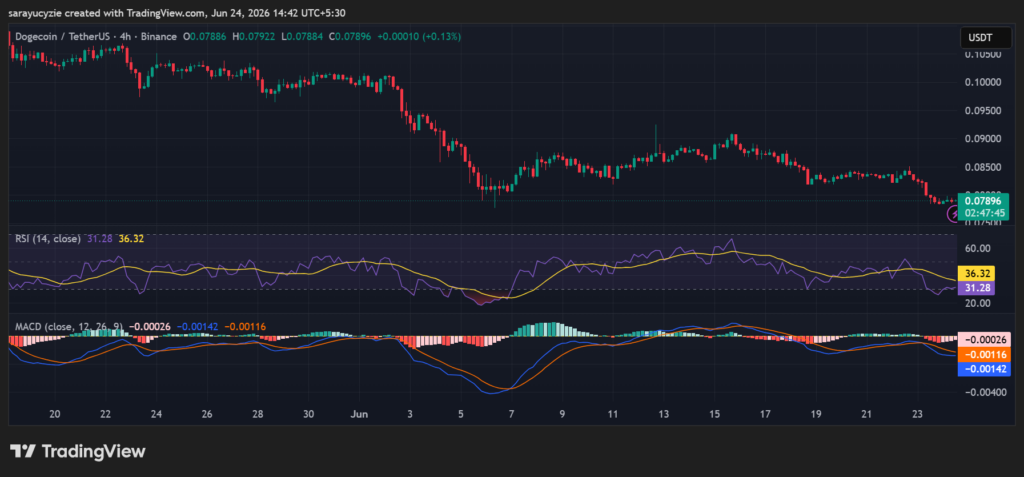
DOGE’s daily Relative Strength Index value is positioned at 31.28, indicating that it is hovering above the oversold territory. As the momentum remains weak, the sellers maintain control as the RSI stays below the neutral level. This points to continued bearish momentum, traders watch for signs of a short-term bounce if selling pressure begins to ease.
MACD measures trend strength and momentum. When it is above the signal line, it increases buying pressure and potential upward price movement. RSI measures the speed of price movements. Readings above 70 show that it is overbought and may face a pullback. Values around 50 reflect a neutral market with no clear directional advantage.
Crypto Market Highlights
Zuckerberg’s Meta Makes a Move Into Prediction Markets With Arena