- Dogecoin has shown significant bullish momentum, rising from $0.3778 to an intraday high of $0.4183.
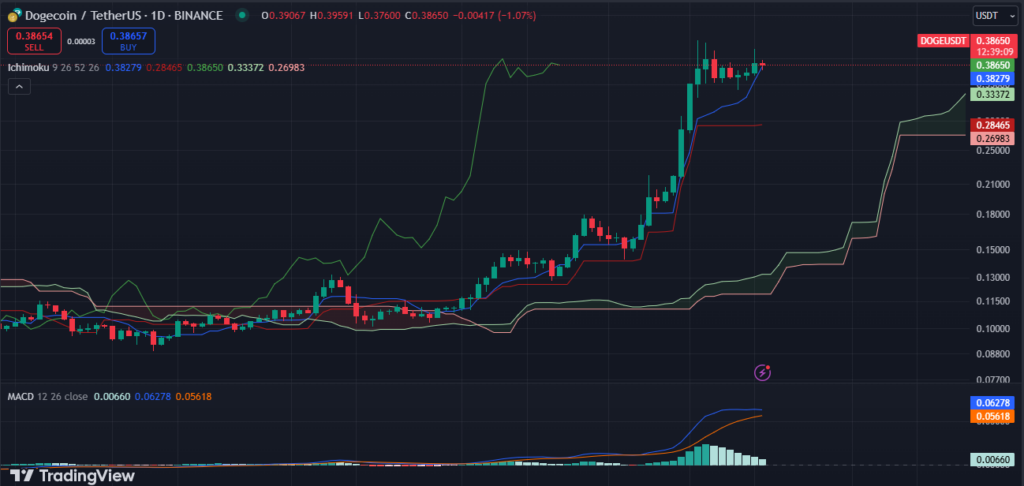
- The Ichimoku Cloud indicator suggests that DOGE could maintain an upward trend and rise above $0.45.
Dogecoin (DOGE) shows signs of a potential breakout as the Ichimoku Cloud suggests continued bullish momentum. While tech mogul Elon Musk’s tweets on DOGE have historically created price pumps, the current rally seems different. The memecoin clearly follows Bitcoin’s trend; as of Nov 20, BTC hit a new all-time high at $94,002. Following this, DOGE climbed from a low of $0.3778 to an intraday high of $0.4183.

At the time of writing, DOGE trading at $0.3933 has seen a 3.2% increase in the last 24 hours, with its daily trading volume climbing to $11.47 billion—an impressive 22.20% jump. This surge in volume reflects growing interest among traders as Dogecoin breaks free from its previous bearish trend.
The recent rally began on November 6, on the day of the US election, when DOGE broke above the prolonged bearish trend above $0.21922. Since then, the memecoin has soared by over 90%, continuing its upward trajectory. Adding to the fuel, Musk’s recent tweet sparked another level of excitement as he posted a photo of himself with the caption “The Dogefather.”
24-H Technicals Shows Bullish Outlook for Dogecoin
The Ichimoku Cloud, a widely used indicator for identifying trends and momentum, offers promising signs for Dogecoin. The conversion line at $0.38279 and the base line at $0.28465 indicate extended upward momentum. Further, the upper boundary at $0.39124 signals a potential breakout if the price stays above $0.38, while the lower boundary at $0.26983 provides a solid support zone.

Beyond the Ichimoku Cloud, other indicators also support a bullish outlook. According to the DOGE/USDT 4-hour chart, the RSI, currently at 55, shows room for upward movement, staying comfortably below overbought levels. Additionally, the MACD has also turned positive, with the MACD line crossing above the signal line, highlighting increasing momentum in the short term.
As all the indicators create a favorable setup for further gains, key resistance levels to watch out for include $0.41, $0.42, and $0.45. If Dogecoin falls below the conversion line at $0.38279, the bullish outlook could be invalidated, with the support at $0.28465. That would mark a short-term bearish turn for Dogecoin. However, if the momentum continues, Dogecoin could be on its way to even higher highs soon.
Highlighted Crypto News Today


