In Chainlink Technical Analysis 2021, we use past statistics, price patterns, RSI, and much other information about LINK to analyze the future movement of the cryptocurrency.
Chainlink is a blockchain abstraction layer that allows universally connected smart contracts. Through a decentralized oracle network, Chainlink enables blockchains to securely interact with external data feeds, events, and payment methods, offering the critical off-chain data needed by complex smart contracts to become the dominant form of digital agreement.
Chainlink (LINK) Current Market Status
According to CoinGecko, the Chainlink price is trading at $29.78 with a 24-hour trading volume of $5,458,333,657, at the time of writing. However, LINK has decreased by 30.88% in the last 24 hours.
LINK holds 14th position on CoinGecko right now. Moreover, LINK has a circulating supply of 426,509,553 LINK and maximum supply of 1,000,000,000. Currently, LINK trades in Binance, Huobi Global, FTX, and Bancor Network.
LINK Technical Analysis 2021
The recent development and upgrades might push Chainlink (LINK) to reach new heights. Now, let’s deep dive into the Chainlink (LINK) technical analysis 2021.
LINK Showing Ascending Scallop Pattern in Hourly Time Frame
The hourly time frame chart below shows the Ascending Scallop pattern of Chainlink (LINK).
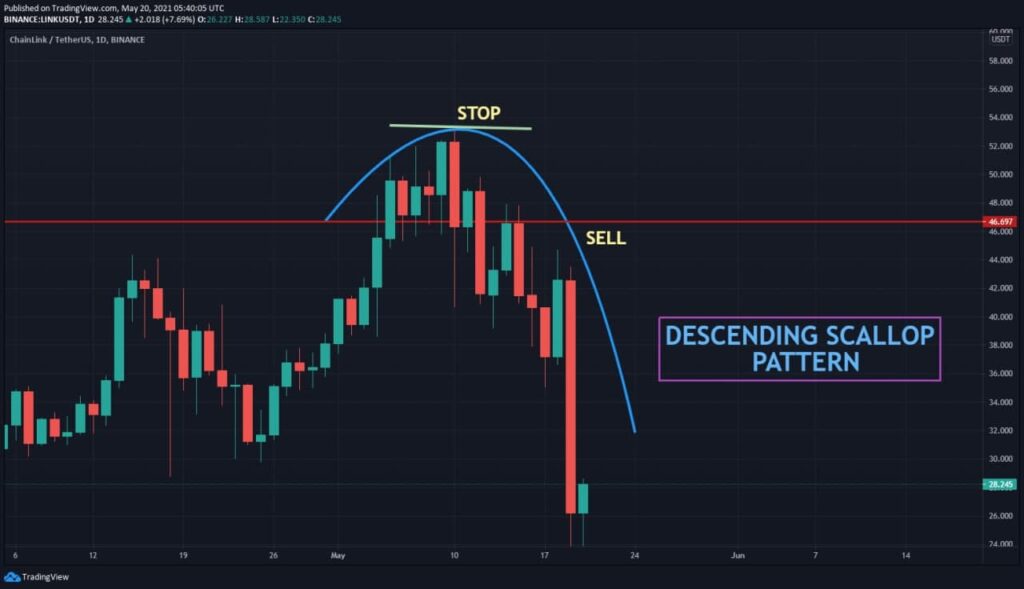
Based on the chart above, the hourly time frame chart has shown the Descending Scallop pattern. However, this pattern is succeeded by a downtrend position but in a few situations, the pattern can change and move into an uptrend position. More so, in this chart above the pattern took less than a month for the formation to take place.
In addition, at the beginning of this pattern, LINK moved from its bullish to bearish trend. This happens as many traders stop buying and start to sell. As a result, the LINK trading volume increased drastically.
Chainlink (LINK) RSI, MACD, MA, and EMA
The below chart shows the Moving Average Convergence/Divergence (MACD) of LINK. Notably, the MACD (blue) continues to stay just below the signal indicator (orange line). This means that cryptocurrency traders can still expect more bearish days ahead.
In contrast, if the MACD begins to move below the signal indicator and performs a bearish crossover. Then the crypto has a high possibility of reaching new lows.
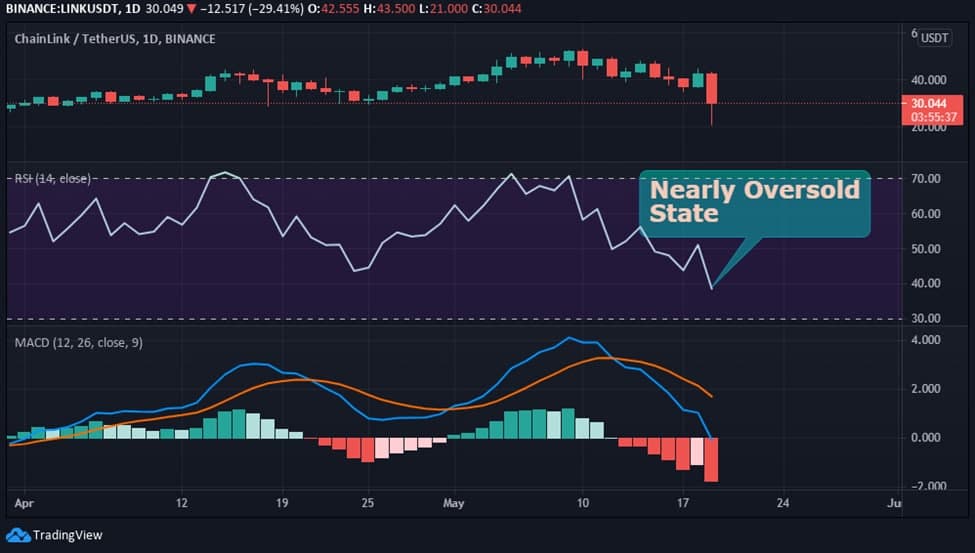
Now let’s look at the relative strength index (RSI) of LINK. As shown in the chart above, the RSI remains at level 40. This shows that LINK price is in nearly oversold state. However, this gives confidence for the traders to trade without any fear.
LINK’s Moving Average (MA) and Exponential Moving Average (EMA) is shown in the chart below. Moreover, MA is a part of technical analysis that helps traders to recognize trends. While EMA is a type of moving average.
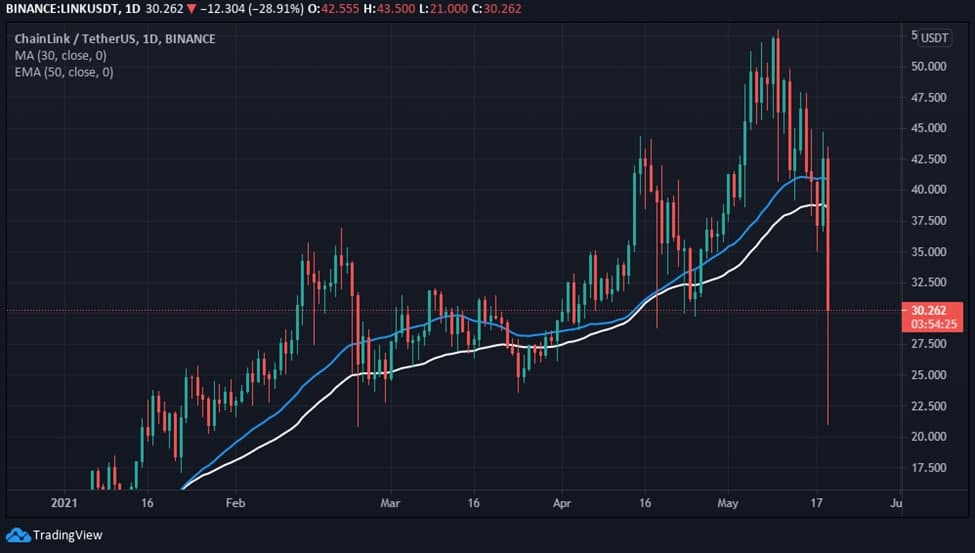
From the beginning of 2021, it is clear that the LINK price has shown many bullish patterns. Furthermore, taking all these into account, LINK could have a competitive market in 2021.
Chainlink (LINK) Showing Ascending Channel Pattern in Monthly Time Frame
The monthly time frame chart below shows the ascending channel pattern.
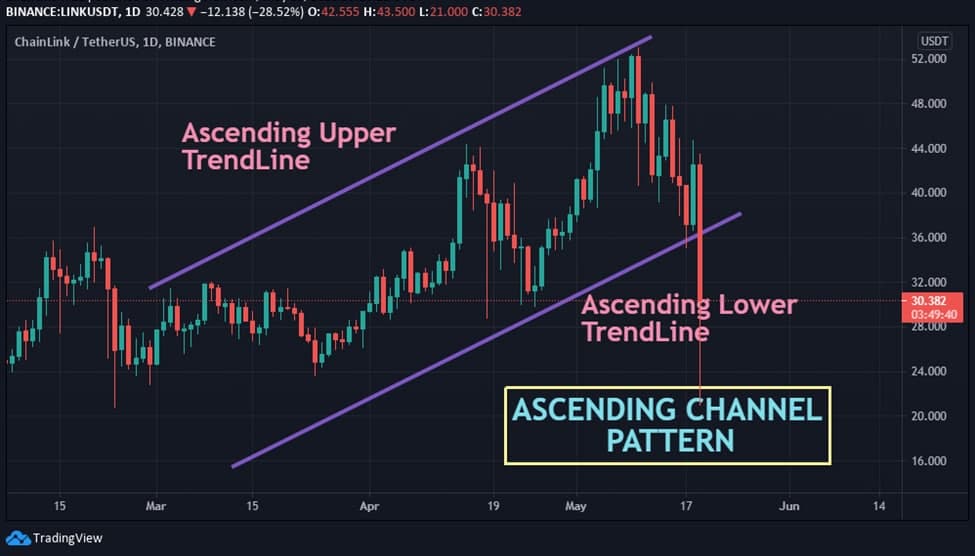
The above chart shows the Ascending Channel pattern in the monthly time frame. An Ascending Channel is the price action that occurs between upper inclining equal trendlines. Moreover, higher highs and higher lows form this price pattern.
Conclusion
With the ongoing developments and upgrades that are taking place within the LINK platform. The cryptocurrency LINK has a fantastic future ahead in this crypto market. However, it is possible to see LINK reaching new heights.
Bullish LINK price prediction 2021 is $60. As said above, it may reach great heights, however reaching $100 if investors have decided that LINK is a good investment in 2021.
FAQ
Chainlink is a blockchain abstraction layer that allows universally connected smart contracts. LINK is the native token of ChainLink.
LINK is listed on many cryptocurrency exchanges that include Binance, Huobi Global, FTX, and Bancor Network. In which the crypto is available to be traded against fiat currencies, stablecoins, and other cryptos.
With the ongoing developments and upgrades within the LINK platform, it has the high possibility of reaching its new ATH soon.
Disclaimer: The opinion expressed in this chart solely author’s. It does not interpreted as investment advice. TheNewsCrypto team encourages all to do their own research before investing.
Recommended for You