In CertiK (CTK) Technical Analysis 2021, we use past statistics, price analysis, RVOL, MA, and much other information about CTK to analyze the future trend of the cryptocurrency.
CertiK Chain, a security-first, delegated proof-of-stake blockchain, for reliable execution of critical business applications such as DeFi, NFT and autonomous vehicles. CTK prioritizes cross-network compatibility and built as a Cosmos Hub with full EVM and Hyperledger Burrow support, as well as eWASM and AntChain support from Ant Financial.
CertiK (CTK) Current Market Status
According to CoinGecko, the CTK price is trading at $1.02 with a 24-hour trading volume of $6,404,523, at the time of writing. However, CTK has decreased by 0.1% in the last 24 hours.
In addition, CTK has a circulating supply of 53,294,026 CTK. Currently, CTK trades in Binance, Tokocrypto, Gate.io, Pionex, and Bithumb.
CertiK (CTK) Technical Analysis 2021
CertiK (CTK) holds the 432nd position on CoinGecko right now. The recent development and upgrades might push CTK to reach new heights. Now, let’s deep dive into the CTK technical analysis 2021. The daily time frame chart of CertiK (CTK) as shown below.

In Wyckoff’s theory, the price cycle of trading instruments includes four stages, they are accumulation, markup, distribution, and markdown.
Accumulation Phase: The accumulation process is displayed in the chart in the form of a price range. In addition, the bulls are gradually expanding, but they can still push up prices. The price pattern on the chart of CTK is flat.
Markup Phase: The bulls have enough power to push prices above the high end of the range. This indicates that the price is in the second phase and a bullish price pattern is being created on the chart.
Distribution Phase: This is the third level of theory. The bear plan is now to regain control of the market. The price is currently flat on the chart, as in the accumulation process. The formation of higher and lower points in the chart indicates that the market is in the Distribution stage. The lower profit margin is caused by price changes, which indicates that the market is currently in a selloff.
Markdown Phase: After the Distribution phase, a price reduction process begins, just like a downward trend, which means that the bears have enough financial strength to pull the market down. When the price breaks through the lower level of the flat range of the horizontal distribution channel on the chart, a markdown will be confirmed.
More so, CTK is currently in the accumulation phase, which indicates that they have more bearish days.
CertiK (CTK) RSI
The below chart shows the relative strength index (RSI) of CTK.

As shown in the above chart, RSI remains at 47.22. This shows that CTK’s price is in neither overbought nor oversold state. However, this shows that traders can trade fearlessly.
CertiK (CTK) RVOL
The below chart shows the Relative Volume of CTK. It is an indicator that indicates to traders how the current trading volume has changed over a period of time compared to the previous trading volume.

Currently, the RVOL of CTK lies below the cutoff line which represents the weaker volume in the current trend.
CertiK (CTK) Moving Average
CTK’s Moving Average (MA) is shown in the chart below. MA supports traders to find trends.

CTK price fell at 50 MA (short-term), but it has not broken through 200 MA. Once it breaks the 200 MA level of CTK, it completely goes to a bearish state.
CTK prices are currently trading around 200MA, so we can expect some reversals at these points.
CertiK (CTK) Price Comparison With Bitcoin
The below chart shows the price comparison between CTK and BTC.
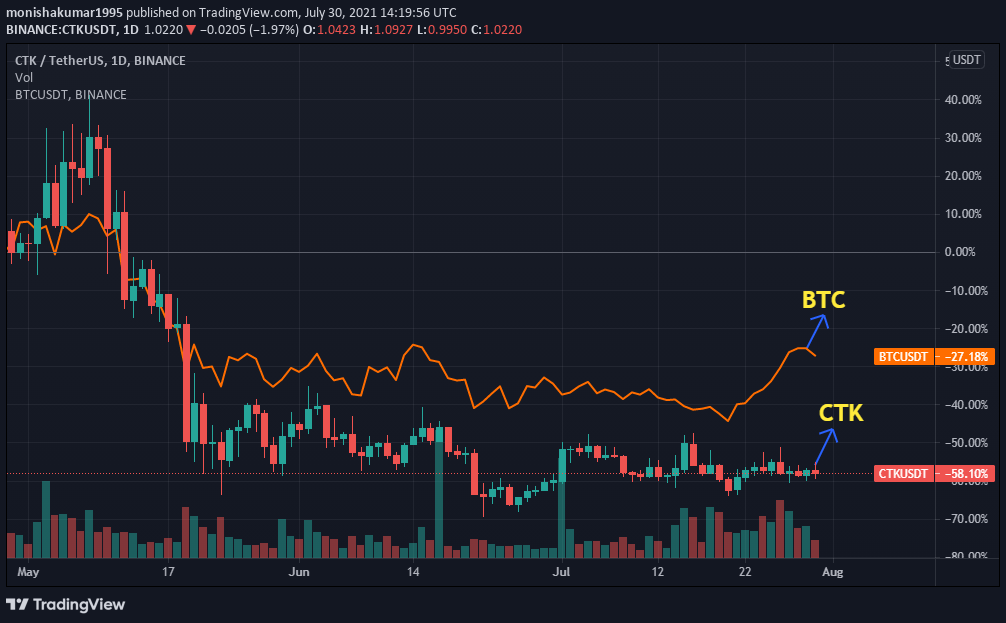
From the chart, we can identify the trend of the BTC and CTK is moving at the same level as the trend. This indicates when the price of BTC increases or decreases, the price of CTK also increases or decreases respectively.
Conclusion
With the ongoing developments and upgrades that are taking place within the CTK platform. CertiK has a great future ahead in this crypto market. However, CTK can reach new heights.
Bullish CTK price prediction 2021 is $3.4. As mentioned above, it may reach great heights, however reaching $4, if investors have decided that CTK is a good investment in 2021.
FAQ
CTK is a Cross-Chain protocol with security assessment and decentralized refund to create secure dApps. Its native coin is CertiK.
CTK is listed on many cryptocurrency exchanges that include Binance, Tokocrypto, Gate.io, Pionex, and Bithumb. It is available for trading against crypto fiat coins, stablecoins, and other cryptocurrencies.
With the ongoing developments and upgrades within the CTK platform, it has the high possibility of reaching its ATH soon.
Disclaimer: The opinion expressed in this chart solely author’s. It does not interpreted as investment advice. TheNewsCrypto team encourages all to do their own research before investing.
Recommended for You