
- BNB hits a new ATH at $1,336.
- Daily trading volume surges over 95%.
The crypto market opened the day on a bearish note, losing over 3.03%. Most of the notable assets are plunging, with only a few sitting on green, shaking. The largest asset, Bitcoin (BTC), is trading on the downside at $121.3K, while Ethereum (ETH), the largest altcoin, has steeply fallen by over 6% to $4.4K.
Turning attention toward BNB, it has convincingly hit its new all-time high more than once yesterday. In the early hours, the asset traded at a bottom range of $1,240. With the bullish shift, the price took the road upward, breaking the crucial resistance between $1,244 and $1,332 zones, hitting a high of $1,336.
The 3.35% recovery has pushed the BNB price to trade at around $1,282, with its market cap touching $178.71 billion. Besides, the daily trading volume has soared by over 95.11%, reaching the $11.93 billion mark. As per Coinglass data, the BNB market has witnessed $22.58 million liquidated in the last 24 hours.

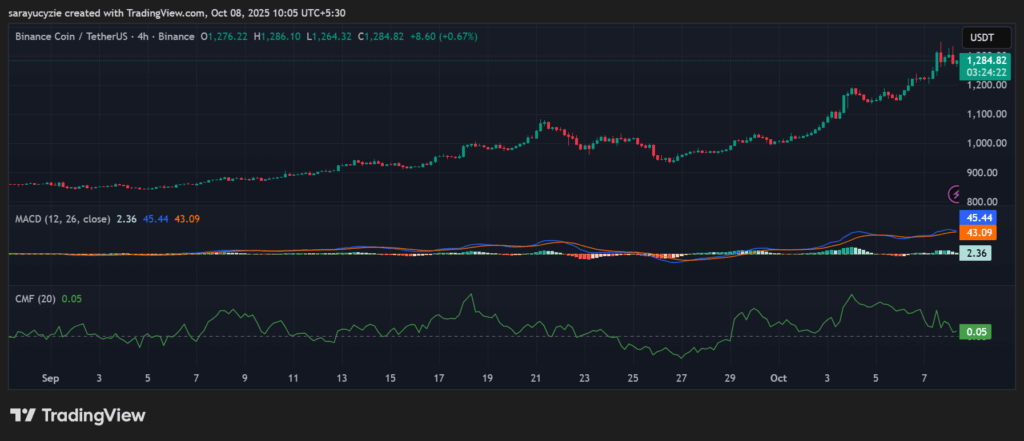
The recent price chart of the BNB/USDT pair brings in a positive outlook. The emerging green candlesticks have swallowed the previous red candles. With this move, the price could climb to the $1,289 resistance. If the golden cross takes place, the bulls might send the price above $1,296.
On the downside, assuming the asset lit the chart with the red candles, the bears might push the price down toward the $1,275 support level. A sturdy bearish pressure could trigger the death cross to unfold, and likely drive the BNB price to its former low at around $1,268 or even lower.
BNB: Bullish Signals Flash Across Technical Charts
While zooming in on the technical analysis of BNB, the Moving Average Convergence Divergence (MACD) line has crossed over the signal line, indicating bullish momentum. The price movement may gain further strength and continue rising. Moreover, the Chaikin Money Flow (CMF) indicator value of 0.05 suggests a slight buying pressure in the asset’s market, but it is weak. Also, a moderate accumulation is happening, not strong enough to confirm a strong trend.
In addition, the daily Relative Strength Index (RSI) found at 67.83 signals a neutral to bullish sentiment. The asset might be approaching the overbought zone if it crosses 70. It could signal the price getting stretched and facing resistance or a correction. BNB’s Bull Bear Power (BBP) reading of 39.36 implies that the bulls have the upper hand in the market. The higher the positive value, the stronger the bullish momentum. The buyers are actively pushing the price higher.
Therefore, the recent trading pattern reveals that the bullish pressure is lingering in the market. An extended correction on the upside will only keep the momentum strong and alive. To see where Binance Coin is headed, dive into our comprehensive long-term analysis that forecasts the price performance of BNB across the critical years of 2025, 2026, and beyond to 2030.
Top Updated Crypto News
Pudgy Penguins (PENGU) Bounce Alert: Will It Break to the Top of the Channel at $0.044?