- Bitcoin’s price has steadily risen since it fell below $6,000 in 2020.
- Pierre Rochard argues that Bitcoin is not a reliable disaster hedge.
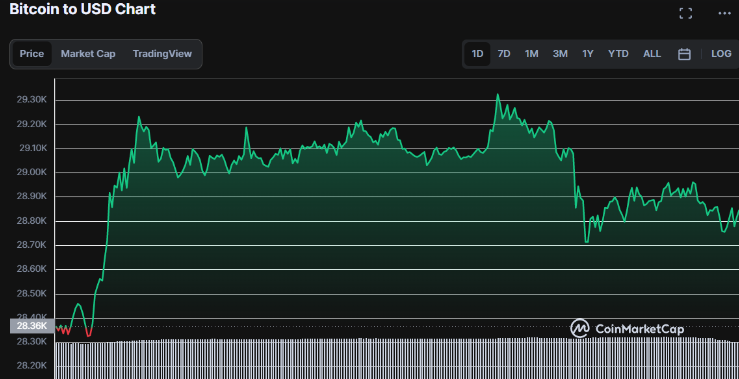
- Bitcoin’s price has surged by 1.83% in the last 24 hours.
The Bitcoin (BTC) trading price has been on the move since the beginning of 2023. Bitcoin has steadily risen since the digital token recorded a price below the $6,000 level in 2020. Pierre Rochard, VP of Research at Riot Platforms, recently claimed on Twitter that data invalidates the belief that Bitcoin serves as a “disaster hedge.” He pointed out that when panic ensued on March 12, 2020, BTC/USD experienced a crash.
It’s a myth that #Bitcoin price is a “disaster hedge”, invalidated by data. Look at March 12 2020 panic, BTCUSD crashed.
— Pierre Rochard (@BitcoinPierre) May 4, 2023
A more realistic way of looking at long-term #Bitcoin price is that it’s a rough proxy metric for global adoption, driven by its user freedom fundamentals.
Instead, he suggests that a more realistic approach to assessing the long-term Bitcoin price is to view it as a rough proxy metric for global adoption, primarily driven by the user freedom fundamentals it offers.
Bitcoin has recorded a price surge of 1.83% in the last 24 hours and is currently traded at $28,882.91. The highest price BTC is being sold at is $29,353.18, acting as the resistance level, while bulls have established a support level of $28,296.75.
Bitcoin’s dominance is currently 47.14%, an increase of 0.39% over the day. The trading volume of BTC has also recorded a surge of 2.49% to $17,681,095,806, indicating that BTC’s price might continue to surge in the market in the coming hours, leading the bulls in BTC to breach above the $29K level.

BTC Technical Indicators
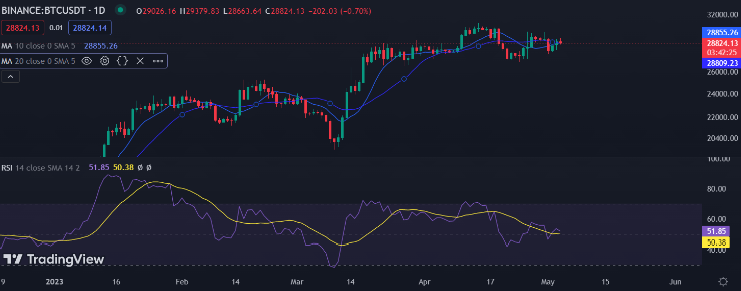
On the 24-hour price analysis of Bitcoin, bulls have dominated the BTC market, as indicated by the Moving Averages (MA). This can be seen as the short-term MA moving above the long-term MA, suggesting that the current optimistic nature of the BTC market might continue in the hours ahead.
However, before entering the BTC market, investors should be cautious because of the movement of the Relative Strength Index (RSI), which is moving in the southern direction, suggesting that a price reversal may be recorded in the market. The current reading of the RSI line is 51.96.

Overall, the recent movement of Bitcoin has been positive, with a steady rise in price since the beginning of the year.
Recommended For You:


