



- Bitcoin price slipped below the $64K mark.
- The bearish crossover is active, and the downtrend accelerates.
The largest asset, Bitcoin (BTC), slipped below the $64K mark and is currently trading at around $63,981. Its daily trading volume has surged by over 50% to $21.78 billion. Moreover, this session ranged between $63,752 and $65,316, with $49.61 million in liquidations recorded in the past 24 hours.
Significantly, $67K was the high in both June and July. Until that level breaks, the upside momentum stays on hold. Everything happening for the asset between $60K and $67K right now is just rattle inside a range that has been playing out for weeks.
Also, Peter Brandt has flagged a potential decline, pointing to a large head-and-shoulders pattern developing on the chart. BTC remains below the $67.2K–$67.5K resistance zone, the exact level that needs to break for any serious rally to develop.
For the longer term, $82,850 remains the critical range bulls need to reclaim to flip the broader bias.
Key Support and Resistance Levels of Bitcoin
Looking at the 4-hour price chart, the BTC price might slip to the $63,842 support range with the bearish pressure. An extended correction on the downside could break momentum deeper, falling below the $63.7K mark. The formation of the death cross brings further traction.
Assuming the trading graph flips bullish, the Bitcoin chart displays buying interest, with the price dominated by upward-moving candles. It could climb and find its resistance at $64K. Continued gains might trigger the emergence of the golden cross, sending the price above $64,199.
Technical Setup: Further Downside for BTC?
The Moving Average Convergence Divergence (MACD) line is below the zero line, confirming that short-term selling pressure is stronger than long-term buying support. The bearish crossover is active, indicating that the downward momentum is accelerating.
Notably, the signal line is found above zero, showing the primary trend of Bitcoin was bullish, but that baseline strength is eroding fast. This is a key warning flag, a sign that a previous uptrend is fracturing into a deeper pullback or a full trend reversal.
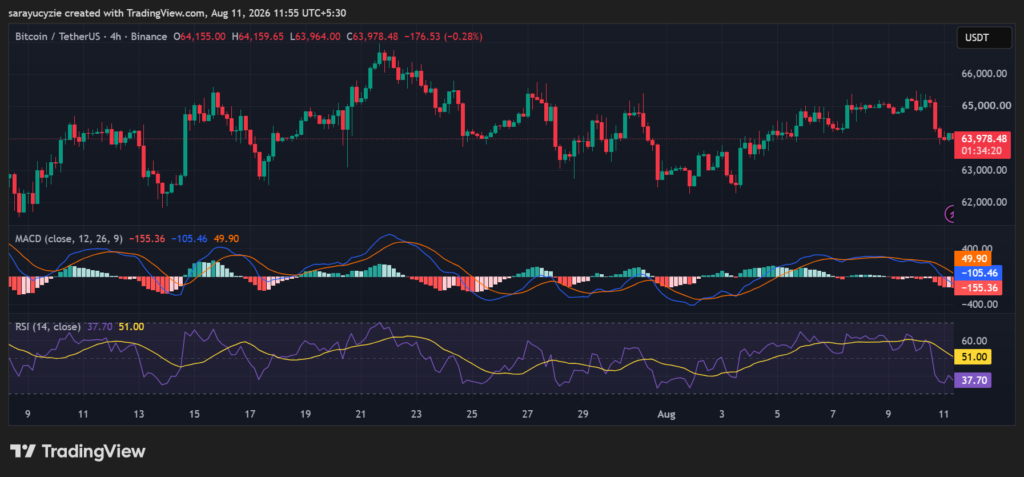
BTC’s daily Relative Strength Index (RSI) value of 37.70 suggests weak, bearish momentum with the sellers currently in control, though drawing near potential bargain territory. As it is sitting below 50 confirms that selling pressure is outpacing buying pressure.
The market is weak and sliding lower, but not yet an extreme dip. The asset is undergoing a heavy pullback, and the momentum favours the bears. Traders prefer to wait until a drop below 30 for a dip-buy, or until it reclaims 50 to confirm that buyers have returned.
Crypto Market Highlights
BOOK OF MEME (BOME) Surges 16%: The Chart Is Pointing Higher