



- Bitcoin is currently hovering at around $62.9K.
- The BTC chart is forming a bearish engulfing pattern.
The dominant digital asset, Bitcoin (BTC), is currently trading at $62,984 with a session range between $62,410 and $64,432. Meanwhile, its trading volume is sitting at $27.84 billion, with the BTC market having seen $97.62 million in liquidations over the past 24 hours.
The 3-day chart from Alicharts exhibits that a TD Sequential sell signal has printed just ahead of August, a month that has historically been associated with Bitcoin pullbacks.
Adding to the bearish case, BTC has printed a bearish engulfing candle on the daily chart and failed to reclaim market structure after rejecting the retest of the broken rising channel. As long as price trades below that structure, the bearish bias remains intact.
Key Support and Resistance Levels of BTC
The immediate picture of the asset’s price trajectory is clear. It needs to break above $65K to generate any lasting serious momentum. Until that happens, any movements of BTC between $60K and $65K are just sideways action.
On the downside, $60K–$61K is the first crucial test. The $58K–$60K zone has been defended repeatedly and remains the strongest support. Moreover, a Bitcoin breakdown below that opens the path to the $55,000 threshold.
One more liquidity sweep remains a real possibility before any recovery attempt becomes the conversation. Also, a TD sell signal and a bear engulfing candle heading into a historically weak month is not a combination bulls want. The next move from $63K will set the tone for the rest of August.
Is Bitcoin Preparing for an Extended Downside?
The Moving Average Convergence Divergence line is below the signal line, and the short-term selling pressure is accelerating, triggering a strong sell signal. Moreover, both lines are below zero, hinting that the overarching market setup is strongly bearish.
Bitcoin is in a heavy sell-off phase. Downward momentum is intensifying on both short-term and long-term timeframes. Traders view this as a clean downtrend-continuation environment within the market.
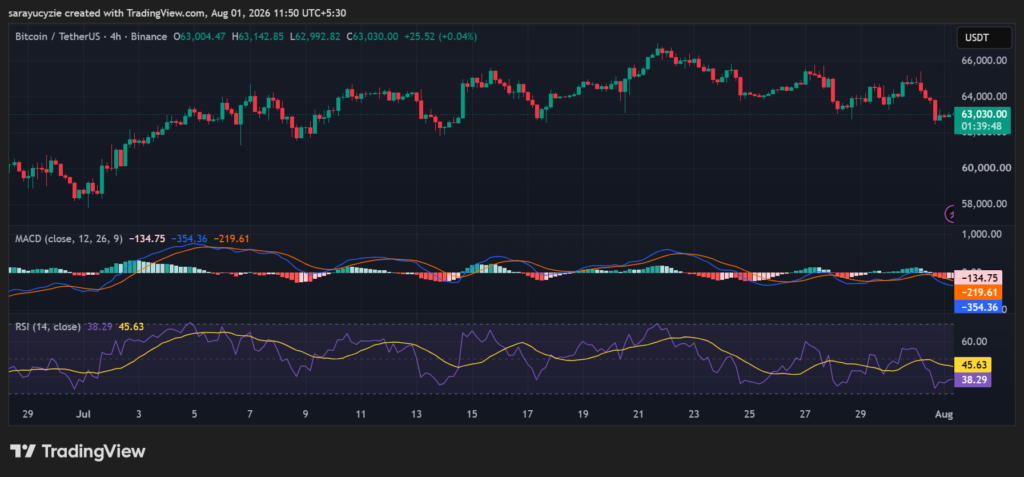
Furthermore, the daily Relative Strength Index (RSI) reading is at 38.29, indicating strong bearish momentum, sitting above the oversold territory. Sellers are in clear control of short-term price action, driving a persistent downward trend.
While momentum favours the bears, the indicator is creeping even lower, where it becomes potentially due for a bounce. BTC Traders look at support levels as it moves closer to 30 for potential signs of buyer exhaustion.
Crypto Market Highlights
Uniswap (UNI) Hits Double-Top Resistance: Can Bulls Force a Breakout as Momentum Slows?