
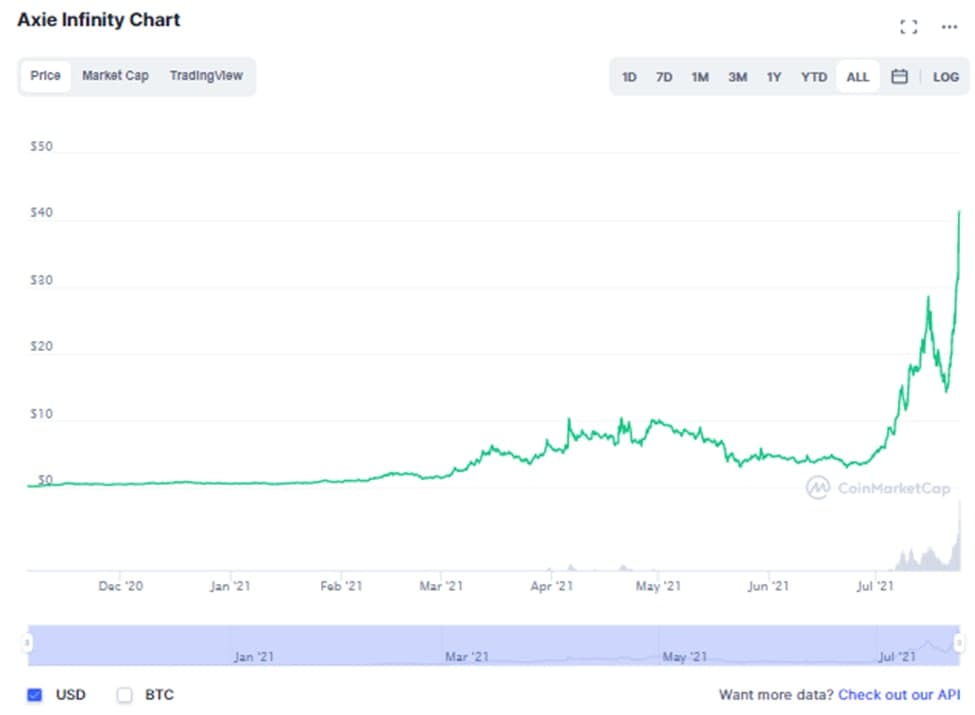
- Axie Infinity (AXS) reached its new all-time high of $48.16 on July 23.
- AXS is a Pokémon-based crypto game.
Axie Infinity (AXS) price reached its new all-time high of $48.16 on July 23, 2021. Axie Infinity is a Pokémon-based crypto game that enables players to gather and breed many fantasy creatures. However, the game’s popularity has increased lately, making Axie as one of the hottest crypto games on the market.
According to CoinMarketCap, the AXS price is at $40.78 with a 24-hour trading volume of $6,527,627,435, at the time of writing.
Each Axie is a non-fungible token (NFT). NFT is considered as another growing sector in the crypto industry. More so, the NFTs are a special type of provably unique tokens that could not be duplicated or counterfeited.
Moreover, NFTs can be minted as one-of-a-kind or in small batches which will become quite popular among collectors. Consequently, prices of such tokens can represent all types of digital media, like artworks, music, video clips, or virtual pets which can reach millions of dollars.
Even more, it is not just the token that’s on a tear either. Notably, the overall protocol makes millions in revenue from in-game fees. Axie Infinity is considered to be the single most beneficial blockchain app in the last 30 day, ahead of various DeFi ‘blue chip’ tokens in Uniswap, Aave, and SushiSwap. All-in-all, AXS has outperformed nearly every other large-cap crypto on the market, which includes Bitcoin (BTC) and Ethereum (ETH) this month.
AXS Showing Bullish Trend
Axie Infinity shows a bullish uptrend pattern. Now let’s look at the AXS chart which is shown below.

The above chart shows the Ascending Scallop patterns. This pattern is observed during a bullish rally and it is shaped like a J, slightly tilted to the right. At the beginning of the pattern, the price fell. After the reversal, the price continues to rise, and the whole pattern looks like a tilted J.
There may be a breakout in any direction, that is, the possibility of trend reversal and trend continual. Breaking a higher high is considered an upward breakout whereas a breakout below the pattern’s low is treated as a downward breakout. A breakout is necessary to confirm the pattern. The chart also shows that the price increased when Bitcoin (BTC) price surged, decreased when it BTC dropped.
Moreover, with the upcoming developments and upgrades within the ecosystem, AXS could reach great heights in the future.
Recommended for You