In AC Milan Fan Token (ACM) Technical Analysis 2021, we use past statistics, price analysis, RSI, RVOL, and much other information about ACM to analyze the future movement of the cryptocurrency.
AC Milan Fan Token is a utility token that offers AC Milan fans a tokenized share of influence on club decisions using the Socios app and services. The token serves as a membership key that allows users to compete for exclusive rewards, club recognition, and more. ACM token holders can vote using smart contracts in the “fan decision” polls published by AC Milan. These token holders can interact with the Socios platform and receive rewards.
AC Milan Fan Token (ACM) Current Market Status
According to Coingecko, the ACM price is trading at $9.29 with a 24-hour trading volume of $3,091,140, at the time of writing. However, ACM has decreased by 1% in the last 24 hours.
In addition, ACM has a circulating supply of 2,000,792 ACM. Currently, ACM trades in Binance, HitBTC, BKEX, Pionex, and Paribu.
AC Milan Fan Token (ACM) Technical Analysis 2021
The recent development and upgrades might push ACM to reach new heights. Now, let’s deep dive into the ACM technical analysis 2021. The daily time frame chart of AC Milan Fan Token (ACM) is shown below.
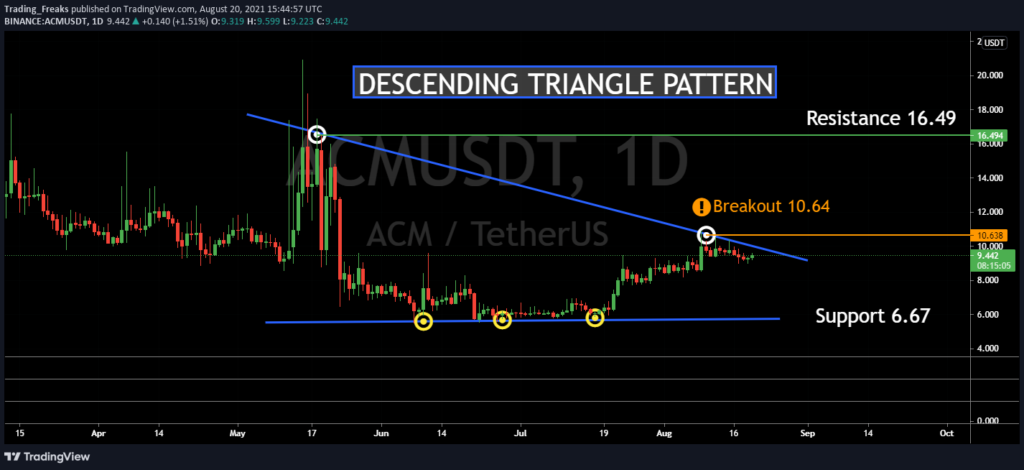
The descending triangle is most commonly seen during downtrends and is often interpreted as a bearish signal. The ascending triangle pattern is reversed in the descending triangle pattern.
As the price continues to make lower highs, descending triangles indicate to investors and traders that sellers are more aggressive than buyers. When the price breaks out of the triangle in the direction of the overall trend, the pattern is complete.
Contrary to popular belief, a descending triangle can be bullish or bearish. A regular descending triangle pattern is traditionally regarded as a bearish chart pattern. A descending triangle pattern, on the other hand, can be bullish.
ACM trades in a range of $9.44. If the price breaks the trend line then it falls to the support level of $6.67. Or else it will reach the resistance level at $16.49.
AC Milan Fan Token (ACM) RSI
The below chart shows the relative strength index (RSI) of ACM.
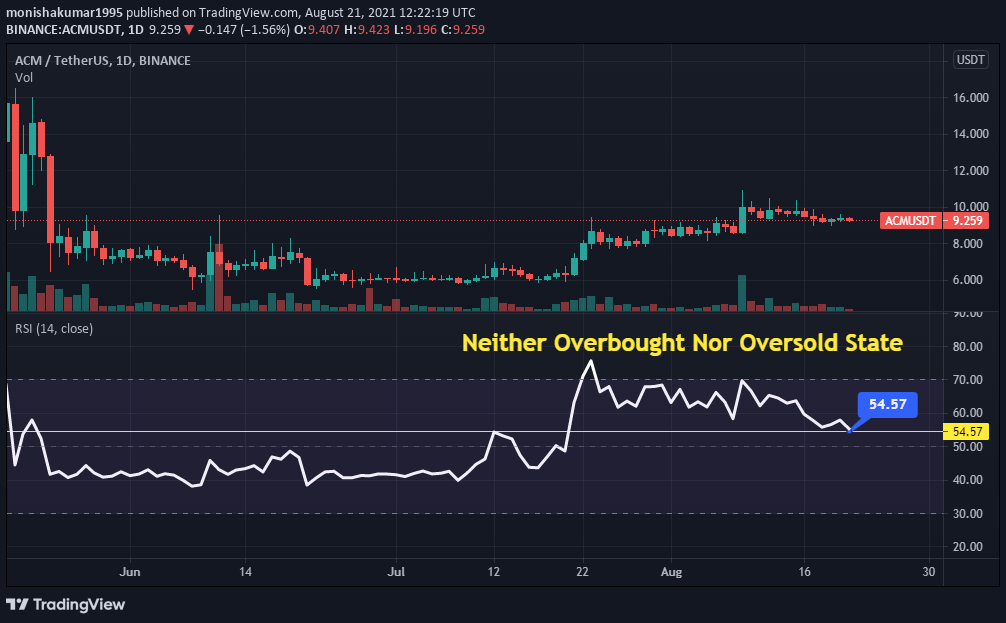
As shown in the above chart, RSI remains at 54.57. This shows that ACM’s price is in a neither overbought nor oversold state. However, this shows that traders can trade fearlessly.
AC Milan Fan Token (ACM) RVOL
The below chart shows the Relative Volume of ACM. RVOL is an indicator that represents to traders how the current trading volume has changed over a while compared to the past trading volume.
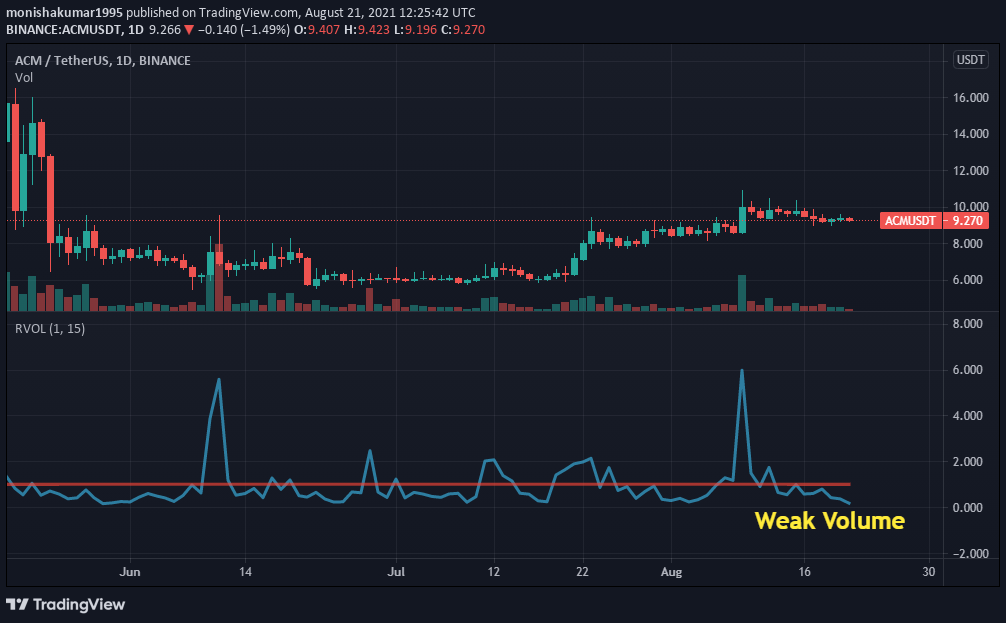
From the above chart, the RVOL of ACM lies below the cutoff line which represents the weaker participants in the current trend.
AC Milan Fan Token (ACM) Moving Average
ACM’s Moving Average (MA) is shown in the chart below. Moving Average is a part of technical analysis that supports traders to find trends.
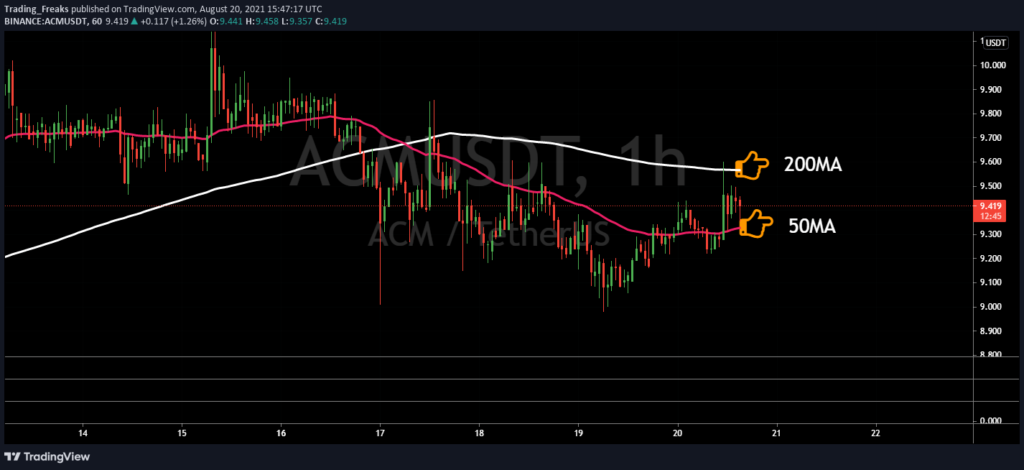
Currently, ACM is in a bullish state. However, the ACM price is above 50 MA (short-term), and it has a high chance of moving higher. Furthermore, ACM’s price is above 50 MA and 200 MA (long-term), so it is completely in a bullish state. Moreover, there is a high possibility of a Trend reversal at any time.
AC Milan Fan Token (ACM) Price Comparison With Bitcoin
The below chart shows the price comparison between ACM and BTC.
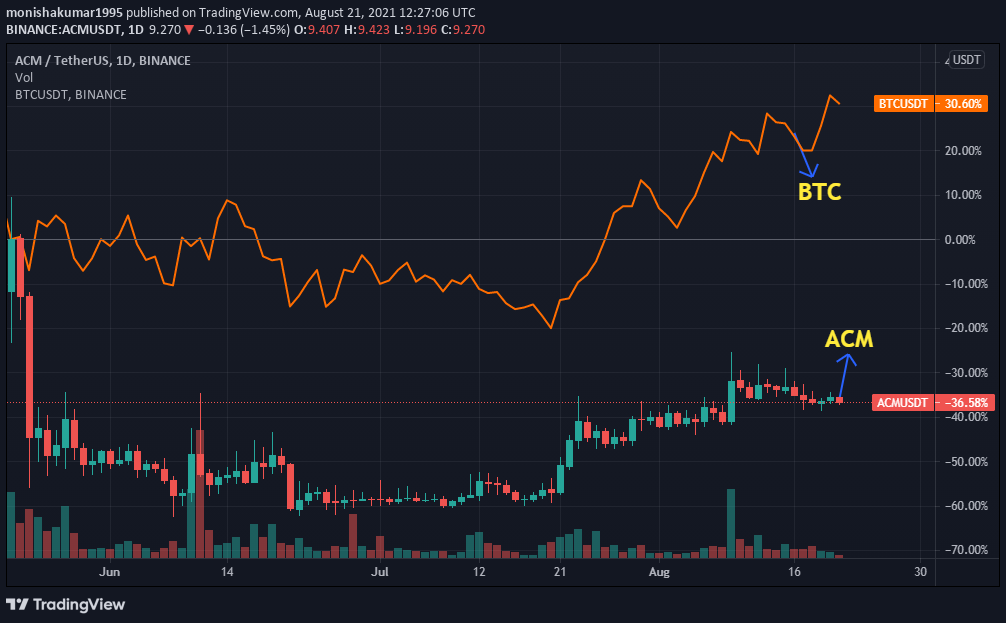
From the chart, we can identify the trend of the BTC and ACM is moving at the same level as the trend. This indicates when the price of BTC increases or decreases, the price of ACM also increases or decreases respectively.
Conclusion
With the ongoing developments and upgrades that are taking place within the ACM platform. AC Milan Fan Token has a great future ahead in this crypto market. However, ACM can reach new heights.
Bullish ACM price prediction 2021 is $10.64. However, as mentioned above, it may reach great heights, however, reaching $16.49, if investors have decided that ACM is a good investment in 2021.
FAQ
ACM are cryptographic assets that grant their holders the right to vote in polls published by AC Milan on the Socios.com app.
ACM is listed on many cryptocurrency exchanges that include Binance, HitBTC, BKEX, Pionex, and Paribu.
The ongoing developments and upgrades inside the ACM platform have a high possibility of reaching its ATH soon.
Disclaimer: The opinion expressed in this chart solely author’s. It does not interpreted as investment advice. TheNewsCrypto team encourages all to do their own research before investing.
Recommended for You