



- AAVE is trading around $134 with a 7.1% gain.
- The broader trend is controlled by the buyers.
As of August 24, the momentum of AAVE is controlled by the bulls. The further direction of the asset is dictated by the pressure applied. It has been attempting a more upside trading pattern, as the technical structure remains positive. The bullish price alignment confirms that if the buyers continue to dominate the broader market trend of AAVE, more upside is not far away.
In addition, as per CoinGecko reporting, the token has posted a 7.1% gain in value and is currently trading near the $134.56 mark. The 24-hour range of AAVE is noted between $121.14 and $144.85. Moreover, the daily trading volume has reached $777.87 million.
The Key Support and Resistance Levels of AAVE
The short-term price structure depends on a few important upcoming ranges of AAVE. The major resistance level might be at $135.78, followed by a level above $137. If a higher zone is observed at around $140, this crucial area decides whether the asset’s price stabilises or continues to climb.
On the other hand, if AAVE momentum flips bearish, the initial support level might be at $133.21. The price falls through $130, and the momentum weakens. A stronger fall below $127.42 confirms that sellers are gaining control, and with a stronger loss in value, the downside continues.
AAVE’s Technical Setup Hints at More Upside
The four-hour chart shows that the Moving Average Convergence Divergence (MACD) line is above the signal line. The short-term upside momentum is accelerating faster than the recent average. As both lines are above zero, it confirms that the broader trend is bullish and buyers are in control.
AAVE is actively moving up with solid buying volume. If the space between the two lines is widening, momentum is building. Vice versa, the momentum is weakening, which often precedes a consolidation phase. The market is bullish, with positive short-term momentum backing the broader uptrend.
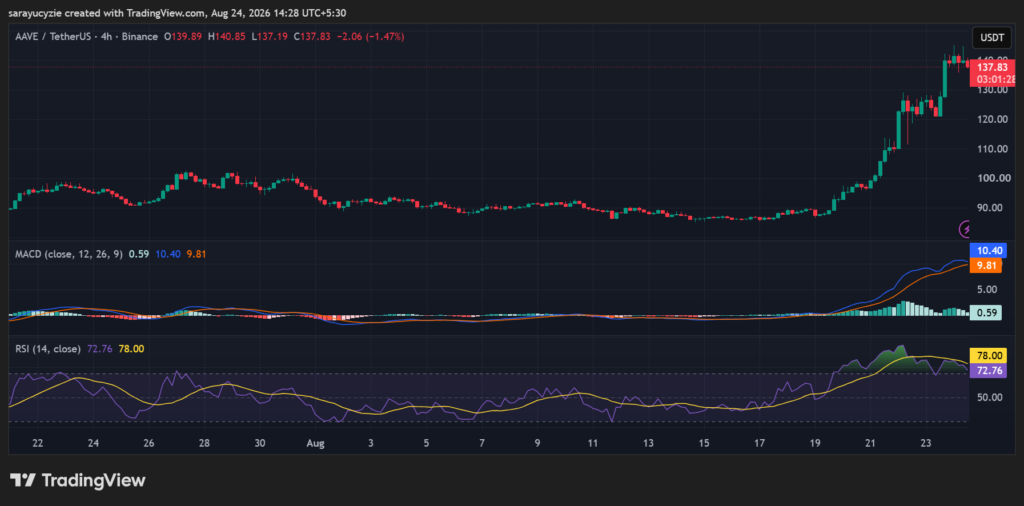
In addition, the daily Relative Strength Index (RSI) reading is at around 72.76, indicating that the asset has crossed into overbought territory. It shows strong and sustained buying pressure over the recent price periods. Also, the short-term buyers are currently in firm control of the price.
While AAVE can remain overbought for extended periods during strong uptrends, it increases the likelihood of a price dip. If price continues making higher highs while it starts making lower highs, it weakens momentum and signals a reversal. A drop below 70 is used by traders as an initial exit.
Crypto Market Highlights
Sui Users on Phantom Face a Major Wallet Change This September