
- XRP has lost over 21%, trading at $2.28 in the past 24 hours.
- The altcoin’s trading volume has surged by over 372%.
The trading day kicked off under the bearish cloud, drowning assets in a sea of red. Major coins, including Bitcoin and Ethereum, took a hit, dropping back to $93.4K and $2.4K respectively. Ripple’s XRP bore the brunt, sinking by over 21.27% in the past 24 hours.
The market is showing increasing downtrend pressure, with the depth of the decline remaining uncertain and entering the correction phase. XRP is currently forming a sturdy bearish pattern with a potential for more downside.
The price has dropped below its crucial support level of $2.34 after recent market fluctuations and investors are closely watching for potential breakout signs.
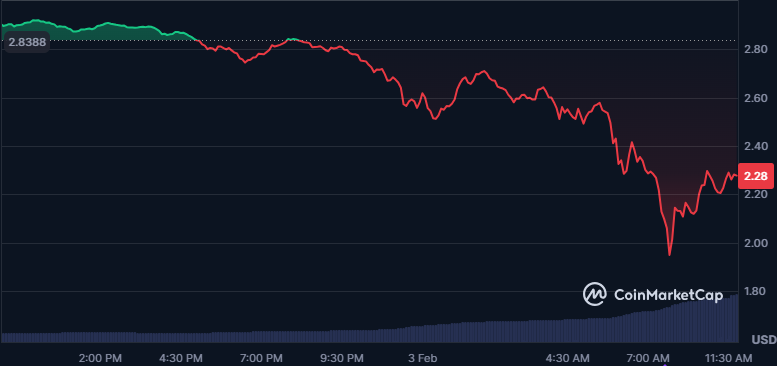
In the early hours, the asset traded at $2.92, gradually the bears took charge and slipped toward the lowest price of $1.95. At the time of writing, XRP trades at $2.28 with its daily trading volume reaching $30.18 billion. The market has witnessed a $116.03 million liquidation of XRP during this timespan.
Notably, the Ali chart exposed the TD Sequential indicator hinted a sell signal a week ago, that the asset is nearing a top or experiencing weakening momentum.
Can XRP Reverse the Bearish Trend?
XRP is facing heavy downside pressure in the four-hour timeframe. Assuming the bearish crossover strengthens, the price might test support at $2.04. Moreover, if the selling pressure holds firm, it could send the XRP price down to $1.84 or lower, exposing further downside risk.
On the other hand, a defence at $2.33 could set the stage for an upside rally. If the accumulation resumes, XRP could push the price toward $2.47. Supposing the demand is resilient enough, it might break above the $2.54 range, and peak to record a new high.
XRP’s Moving Average Convergence Divergence (MACD) line and signal line are both settled beneath the zero line. This indicates the bearish crossover and sellers are in control of the market. A continued position below zero confirms continued weakness.
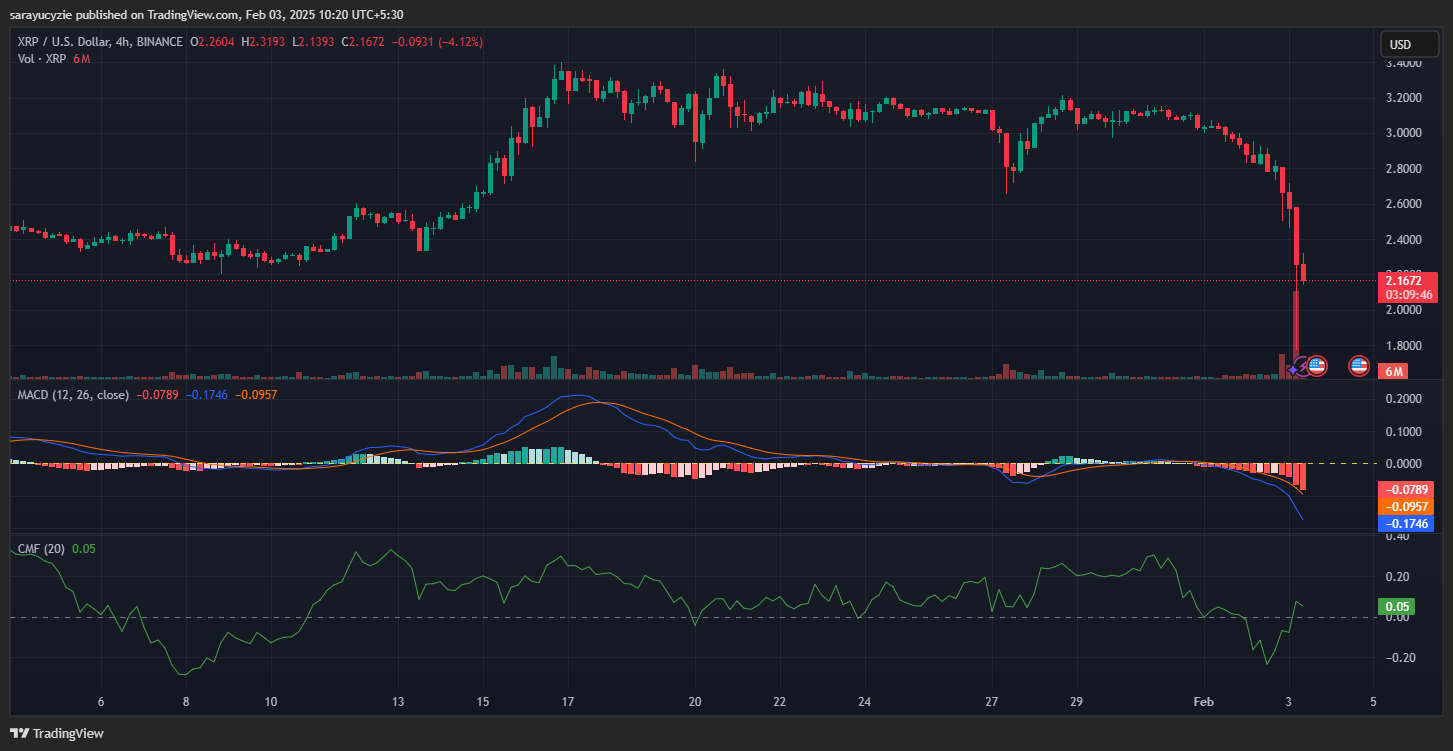
Additionally, the Chaikin Money Flow (CMF) indicator stationed at 0.05, signals a positive flow with mild buying pressure. The value is modest, and a decline below zero might fade buying interest. Meanwhile, XRP’s trading volume has surged by 372%.
The daily price chart of the altcoin displays the short-term 9-day moving average below the long-term 21-day moving average. Besides, XRP’s daily relative strength index (RSI) was found at 11.48 in the extremely oversold territory. It suggests that the bears are firmly in control.
Disclaimer: The opinion expressed in this article is solely the author’s. It does not represent any investment advice. TheNewsCrypto team encourages all to do their own research before investing.
Highlighted Crypto News