
- Bullish XDC price prediction for 2025 is $0.10815 to $0.20484.
- XDC Network (XDC) price might reach $0.3 soon.
- Bearish XDC price prediction for 2025 is $0.02639.
In this XDC Network (XDC) price prediction 2025, 2026-2030, we will analyze the price patterns of XDC by using accurate trader-friendly technical analysis indicators and predict the future movement of the cryptocurrency.
TABLE OF CONTENTS |
INTRODUCTION |
|
XDC NETWORK (XDC) PRICE PREDICTION 2025 |
|
| XDC NETWORK (XDC) PRICE PREDICTION 2026, 2027-2030 |
| CONCLUSION |
| FAQ |
XDC Network Current Market Status
| Current Price | $0.09365 | 24 – Hour Price Change | 2.12% Up |
| 24 – Hour Trading Volume | $45.69M |
| Market Cap | $1.39B |
| Circulating Supply | 14.93B XDC | All – Time High | $0.1939 (On Aug 21, 2021) |
| All – Time Low | $0.0001571 (On Jun 20, 2019) |
What is XDC Network (XDC)
| TICKER | XDC |
| BLOCKCHAIN | XinFin Hybrid Blockchain |
| CATEGORY | Ethereum scaling solutions |
| LAUNCHED ON | March 2017 |
| UTILITIES | Governance, gas fees & rewards |
XDC serves as the fuel token for the XinFin Network, an enterprise-ready blockchain featuring a hybrid (public/private) architecture. With EVM compatibility, the network caters to enterprises looking to build or scale their infrastructure within a blockchain ecosystem. From seamless interoperable smart contracts to frictionless payments, XDC Network provides all the necessary resources for various blockchain use cases.
Moreover, XinFin’s mainnet token, XDC, presents a real-world utility, exemplified by platforms like TradeFinex.org. This allows small and medium businesses or institutions to create their financial requirements digitally and distribute them to banks or non-bank lenders through a common distribution standard, streamlining the financial origination process.
Further, XDC Network is about to reach its next major milestone as XDC 2.0 prepares to launch its mainnet upgrade at block number 80,370,000. This upgrade will introduce the XDPOS Consensus 2.0, based on the Chained HotStuff Byzantine Fault Tolerance (BFT) algorithm, aimed at enhancing security, efficiency, and user experience across the network.
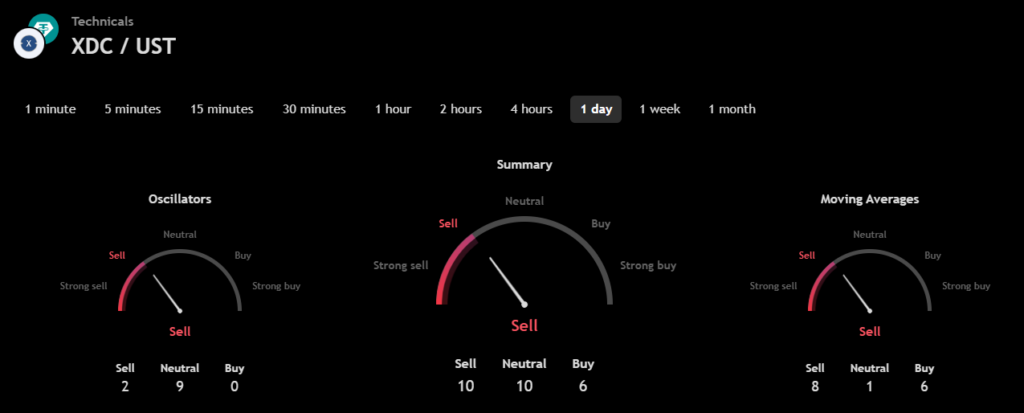
XDC Network (XDC) 24H Technicals
XDC Network (XDC) Price Prediction 2025
XDC Network (XDC) ranks 63rd on CoinMarketCap in terms of its market capitalization. The overview of the XDC Network price prediction for 2025 is explained below with a daily time frame.
In the above chart, XDC Network (XDC) laid out a Symmetric Triangle pattern. Symmetrical triangles form during price consolidation, characterized by two converging trend lines of similar slopes. This pattern typically precedes a breakout or breakdown, where breaking the lower trend line initiates a bearish trend while breaking the upper trend line indicates a bullish trend’s start. The breakout or breakdown targets are determined by measuring the distance between the pattern’s initial high and low, applied to the breakout or breakdown point.
At the time of analysis, the price of XDC Network (XDC) was recorded at $0.119. If the pattern trend continues, then the price of XDC might reach the resistance levels of $0.09888, and $0.10922. If the trend reverses, then the price of XDC may fall to the support levels of $0.08442 and $0.07820.
XDC Network (XDC) Resistance and Support Levels
The chart given below elucidates the possible resistance and support levels of XDC Network (XDC) in 2025.
From the above chart, we can analyze and identify the following as resistance and support levels of XDC Network (XDC) for 2025.
| Resistance Level 1 | $0.10815 |
| Resistance Level 2 | $0.20484 |
| Support Level 1 | $0.05628 |
| Support Level 2 | $0.02639 |
XDC Network (XDC) Price Prediction 2025 — RVOL, MA, and RSI
The technical analysis indicators such as Relative Volume (RVOL), Moving Average (MA), and Relative Strength Index (RSI) of XDC Network (XDC) are shown in the chart below.
From the readings on the chart above, we can make the following inferences regarding the current XDC Network (XDC) market in 2025.
| INDICATOR | PURPOSE | READING | INFERENCE |
| 50-Day Moving Average (50MA) | Nature of the current trend by comparing the average price over 50 days | 50 MA = $0.09943 Price = $0.09596 (50MA > Price) | Bearish/Downtrend |
| Relative Strength Index (RSI) | Magnitude of price change;Analyzing oversold & overbought conditions | Magnitude of price change; Analyzing oversold & overbought conditions | Nearly Oversold |
| Relative Volume (RVOL) | Asset’s trading volume in relation to its recent average volumes | Below cutoff line | Weak volume |
XDC Network (XDC) Price Prediction 2025 — ADX, RVI
In the below chart, we analyze the strength and volatility of XDC Network (XDC) using the following technical analysis indicators — Average Directional Index (ADX) and Relative Volatility Index (RVI).
From the readings on the chart above, we can make the following inferences regarding the price momentum of XDC Network (XDC).
| INDICATOR | PURPOSE | READING | INFERENCE |
| Average Directional Index (ADX) | Strength of the trend momentum | 20.53209 | Weak Trend |
| Relative Volatility Index (RVI) | Volatility over a specific period | 49.41 <50 = Low >50 = High | Low volatility |
Comparison of XDC with BTC, ETH
Let us now compare the price movements of XDC Network (XDC with that of Bitcoin (BTC), and Ethereum (ETH).
From the above chart, we can interpret that the price action of XDC is similar to that of BTC and ETH. That is, when the price of BTC and ETH increases or decreases, the price of XDC also increases or decreases respectively.
XDC Network (XDC) Price Prediction 2026, 2027 – 2030
With the help of the aforementioned technical analysis indicators and trend patterns, let us predict the price of XDC Network (XDC) between 2026, 2027, 2028, 2029 and 2030.
| Year | Bullish Price | Bearish Price |
| XDC Network (XDC) Price Prediction 2026 | $1.5 | $0.009 |
| XDC Network (XDC) Price Prediction 2027 | $1.9 | $0.008 |
| XDC Network (XDC) Price Prediction 2028 | $2.3 | $0.007 |
| XDC Network (XDC) Price Prediction 2029 | $2.7 | $0.006 |
| XDC Network (XDC) Price Prediction 2030 | $3 | $0.005 |
Conclusion
If XDC Network (XDC) establishes itself as a good investment in 2025, this year would be favorable to the cryptocurrency. In conclusion, the bullish XDC Network (XDC) price prediction for 2025 is $0.20484. Comparatively, if unfavorable sentiment is triggered, the bearish XDC Network (XDC) price prediction for 2025 is $0.02639.
If the market momentum and investors’ sentiment positively elevate, then XDC Network (XDC) might hit $1. Furthermore, with future upgrades and advancements in the XDC Network ecosystem, XDC might surpass its current all-time high (ATH) of $0.1939, and mark its new ATH.
FAQ
1. What is XDC Network (XDC)?
XDC is the fuel token of the XinFin network. XDC Network is an enterprise-ready blockchain with a hybrid (public/private) architecture.
2. Where can you purchase XDC Network (XDC)?
XDC Network (XDC) has been listed on many crypto exchanges which include Bybit, DigiFinex, Bitget, Bitrue, and LBank.
3. Will XDC Network (XDC) reach a new ATH soon?
With the ongoing developments and upgrades within the XDC Network Platform, XDC has a high possibility of reaching its ATH soon.
4. What is the current all-time high (ATH) of XDC Network (XDC)?
On Aug 21, 2021, XDC Network (XDC) reached its new all-time high (ATH) of $0.1939.
5. What is the lowest price of XDC Network (XDC)?
According to CoinMarketCap, XDC hit its all-time low (ATL) of $0.0001571, on Jun 20, 2019.
6. Will XDC Network (XDC) reach $0.3?
If XDC Network (XDC) becomes one of the active cryptocurrencies that majorly maintain a bullish trend, it might rally to hit $0.3 soon.
7. What will be XDC Network (XDC) price by 2026?
XDC Network (XDC) price is expected to reach $1.5 by 2026.
8. What will be XDC Network (XDC) price by 2027?
XDC Network (XDC) price is expected to reach $1.9 by 2027.
9. What will be XDC Network (XDC) price by 2028?
XDC Network (XDC) is expected to reach $2.3 by 2028.
10. What will be XDC Network (XDC) price by 2029?
XDC Network (XDC) is expected to reach $2.7 by 2029.
Top Crypto Predictions
FLOKI (FLOKI) Price Prediction
dogwifhat (WIF) Price Prediction
Disclaimer: The opinion expressed in this article is solely the author’s. It does not represent any investment advice. TheNewsCrypto team encourages all to do their own research before investing.