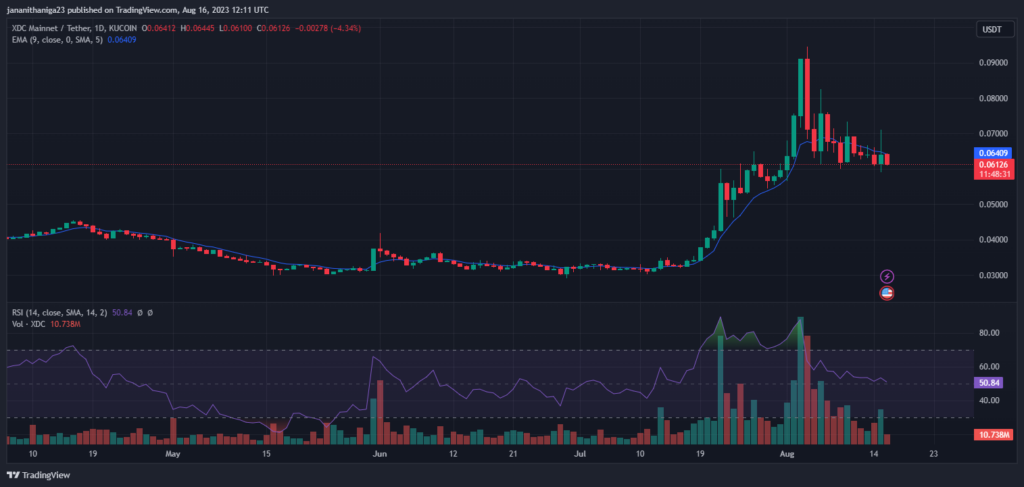
- XDC surges over 93.35% in a month while the crypto market has been showing a negative sentiment.
- The trading volume remains low, experiencing a decrease of 26.20%.
XDC Network, a prominent cryptocurrency ranked among the top 50 by market capitalization, experienced a noteworthy surge of 4.26% within a span of 24 hours. However, it endured a challenging week, with its prices dropping by over 6.06%. Taking a broader view of the month, it exhibited an impressive surge of 93.35%. This upward trajectory commenced on July 20, when the coin was valued at $0.03, as indicated by CoinmarketCap.
Despite these positive trends, the current market sentiment has shifted towards bearish pressure, leading to a notable decrease of 26.20% in trading volume. This has prompted caution among investors and impacted the ongoing investigation. But while other altcoins are down over 90% from their All-Time High , XDC is down only 69% from its ATH.
In the midst of an overall crypto market capitalization decline of 1.37%, XDC’s market capitalization has only dipped by 3.74%, resting at $856,158,27. This resilience is attributed to several factors, including XDC Network’s utilization for streetwear guarantees on eBay, integration with Chainlink’s Oracle network, and a productive partnership with R3 Corda to enhance interoperability.
Also, the anticipation is in harmony with the token’s escalating value and the project’s sponsorship of WebX 2023 by SBI VC Trade, a Japanese cryptocurrency trading firm. Moreover, with the prospect of additional future updates, there is an expectation that the prevailing bearish trend could potentially weaken.
Where is the Price of XDC Headed?
A detailed analysis of XDC’s daily price chart unveils a prevailing bearish sentiment. The price has been consolidating, favoring bears. However, the daily Relative Strength Index (RSI) hovers around the neutral zone at a value of 51.

Predicting potential future scenarios. If the ongoing pattern persists, the price of XDC could ascend to resistance levels of $0.07690 and $0.12866. Conversely, if the trend reverses, the price might retreat to support levels of $0.06538 and $0.05673.
Will XDC pull a bullish rally yet again ? Share us your thought by tweeting us @The_NewsCrypto


