
- Litecoin is trading in the $113 range after a spike of over 6%, leading the gainers.
- LTC’s daily trading volume has surged by more than 98%.
With fear lingering in the crypto market, assets display mixed signals. Bitcoin holds at $96K, while Ethereum trades at $2.6K. Meanwhile, Litecoin (LTC) leads the gainers with a 6.39% daily surge.
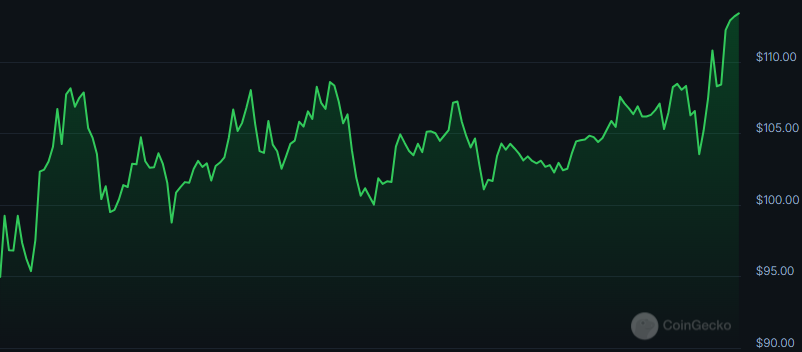
Litecoin fell back to the $102.52 level in the early hours, before the bull appearance. Later, the LTC bulls drove up the price to reach $113.84. At press time, the asset traded at $113.38, with the latent ability for more upside.
Furthermore, the market has observed a liquidation of $1.94 million worth of Litecoin, as per Coinglass. Besides, the daily trading volume of LTC reached $950 million.
Over the last seven days, the asset has surged by 21.31%. The week began trading at $94.15, and the price momentum was highly volatile. Eventually, legged up to the current trading level.
Meanwhile, an analyst chart suggests that Litecoin is in a long-term accumulation phase, with expectations of a breakout in the next two years once liquidity improves. Despite the liquidity shortage, it has consistently formed higher lows, demonstrating resilience and indicating a potential breakout.
Will LTC Hold Onto Its Recent Gains?
LTC’s four-hour price chart exhibits adequate room to advance with the potential for further upside recovery. The asset may find its nearby resistance at $116.88. Upon clearing the $117 level, Litecoin could target the crucial $123.64 range.
However, a reversal of the upside correction forms a death cross, letting Litecoin retest the $106.78 support. If this support collapses, the LTC price could retrace toward the $100 mark acting as a crucial inflection point for the asset.
The Moving Average Convergence Divergence (MACD) line of Litecoin crosses above the signal line. It signals a bullish crossover, that the upward price movement may continue. Traders often interpret this as a buy signal.

Moreover, the Chaikin Money Flow (CMF) indicator is settled at 0.18, which suggests that money is flowing into the asset with strong buying pressure. Meanwhile, Litecoin’s daily trading volume has surged by 98.60%.
Additionally, Litecoin’s daily relative strength index (RSI) of 51.76 indicates neutral momentum, with no strong bullish or bearish bias. The daily trading chart of LTC reveals the short-term 9-day MA below the long-term 21-day MA.
Disclaimer: The opinion expressed in this article is solely the author’s. It does not represent any investment advice. TheNewsCrypto team encourages all to do their own research before investing.
Highlighted Crypto News
TST Price Skyrockets 700%, What is its Controversy With Binance?