
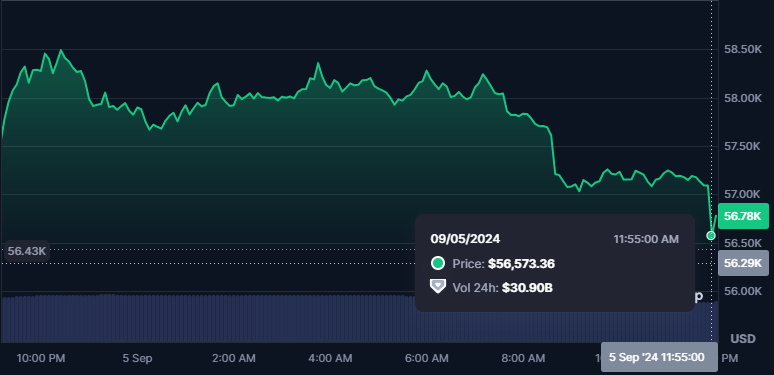
- After a brief rally to $58,492, Bitcoin’s price has fallen and is currently trading at $56,753.
- BTC has struggled to break through $60K, consolidating between $56K and $58K.
- Bitcoin’s U.S. spot ETFs have seen six consecutive days of outflows, with $37.29 million recorded in net outflows.
Bitcoin price movement has drawn significant attention from traders over the past month, with many anticipating a recovery. However, the cryptocurrency has struggled to break through the $60,000 resistance zone. Since the start of September, Bitcoin price fluctuations have remained between $55,500 to $58,000.
In the past 24 hours, BTC reached a high of $58,492, marking a modest 3.75% increase, but soon began to decline during the evening hours of September 4, continuing this trend into the present. At the time of writing, Bitcoin priced at $56,753, with a market capitalization of $1.12 trillion and a daily trading volume of $31.73 billion, according to CMC data.
This drop in Bitcoin’s price movement has also affected the overall cryptocurrency market, including major altcoins like Ethereum (ETH) and Binance Coin (BNB).
This Bitcoin price fluctuation led to $31.63 million in liquidations over the past 24 hours, representing 33.4% of the total $92.14 million in liquidations across the overall market, according to Coinglass.
Additionally, Bitcoin’s U.S. spot ETFs have seen six consecutive days of outflows, starting from August 27. Data from Sosovalue hints that BTC ETFs recorded net outflows totaling $37.29 million, with three out of 12 ETFs showing withdrawals. However, Bitwise was the only ETF to report an inflow, receiving $9.46 million.
Bitcoin Price Movement Shows Bearish Trends
On the technical front, current Bitcoin price movement shows a bearish crossover on September 4, with the 50-day moving average crossing below the 200-day moving average on the 4-hour chart. According to the Bitcoin market analysis, this negative trend is supported by the Moving Average Convergence Divergence (MACD) indicator, where the signal line has fallen below the MACD line.
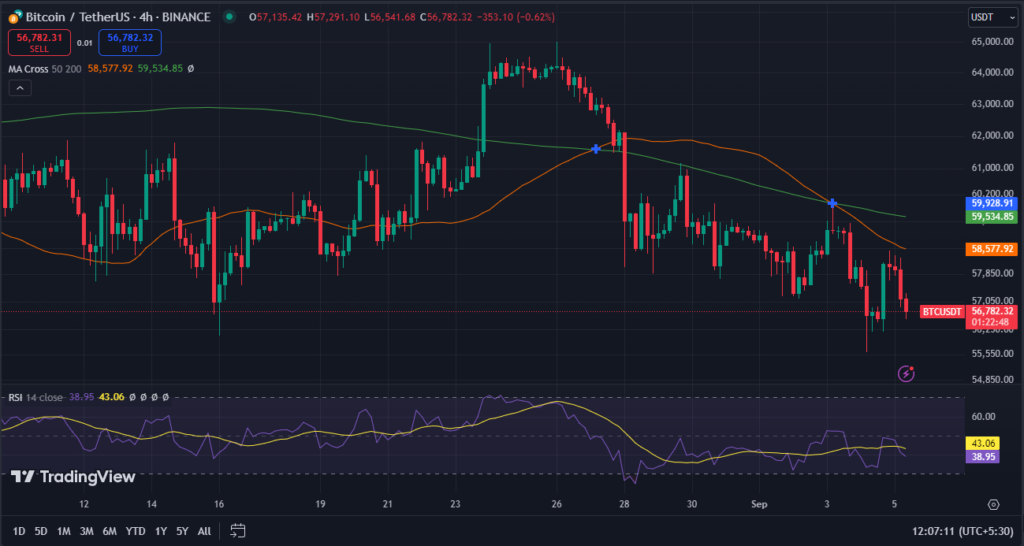
BTC’s RSI stands at 43.30, indicating the market is nearing oversold conditions but hasn’t hit extreme levels yet, as per TradingView market analysis. This suggests some selling pressure but not a full-on buying opportunity.
In that case, if Bitcoin reaches the $58,000 zone again, there is a chance it could slip below the $55,000 zone, based on current market trends.