
- Bitcoin price rallied to $68K in the last 24 hours.
- BTC market sentiment enters the greed zone, as the fear and greed index stays at 70.
This week began on a bullish note, as Bitcoin (BTC) price maintained its price momentum above $65K. In the past 24 hours, the largest crypto went over $68K, with a spike of 0.52%. Notably, this optimistic momentum comes along with the happenings within the US political scene.
The unexpected announcement of Joe Biden’s withdrawal from the election could redefine the electoral pattern and have considerable repercussions on the crypto market, particularly on Bitcoin. Following that, a slight price change was found in BTC price action. The asset stabilized at around $67K after trading within the $62K-$66K range last week.
In addition, Gary Gensler, chairperson of the US SEC, will likely resign in early 2025 after Biden‘s term ends. The SEC Chair’s term officially ends in June 2026, but political dynamics could hasten his departure.
Furthermore, the crypto community highly speculates Tesla CEO Elon Musk’s Laser Eyes on his X profile amid Biden’s drop-out from the US Presidential race 2024. This suggests that Musk expressed his support for Republican candidate Donald Trump, known for his pro-crypto stance. Generally, laser eyes are seen as a favorable sign to highlight one’s support for Bitcoin within the crypto community. On the other hand, there is another speculation that has raised — Elon Musk is joining The Bitcoin Conference 2024, with Trump. Will Bitcoin price hit $70K amidst the crypto-linked U.S. political prospect?
Will the BTC Bears Stay Reserved?
The monthly low was observed at $53,905, and gradually the asset picked up a bullish momentum, resulting in an increase of 4.75%. In the weekly timeframe, BTC saw a spike of 7.31%. At press time, Bitcoin traded at $67,219, and the daily trading volume has soared by 67.38% and stood at $30.18 billion, according to CMC data.
Meanwhile, the BTC Fear and Greed Index stays at 70, suggesting greed in the market. By evaluating the BTC price chart, the daily relative strength index (RSI), which stands at 66.48, hints that the asset is approaching the overbought zone. The short-term 9-day and 21-day moving averages are noted at $65,282 and $61,185 respectively, indicating a slight bullish rally.
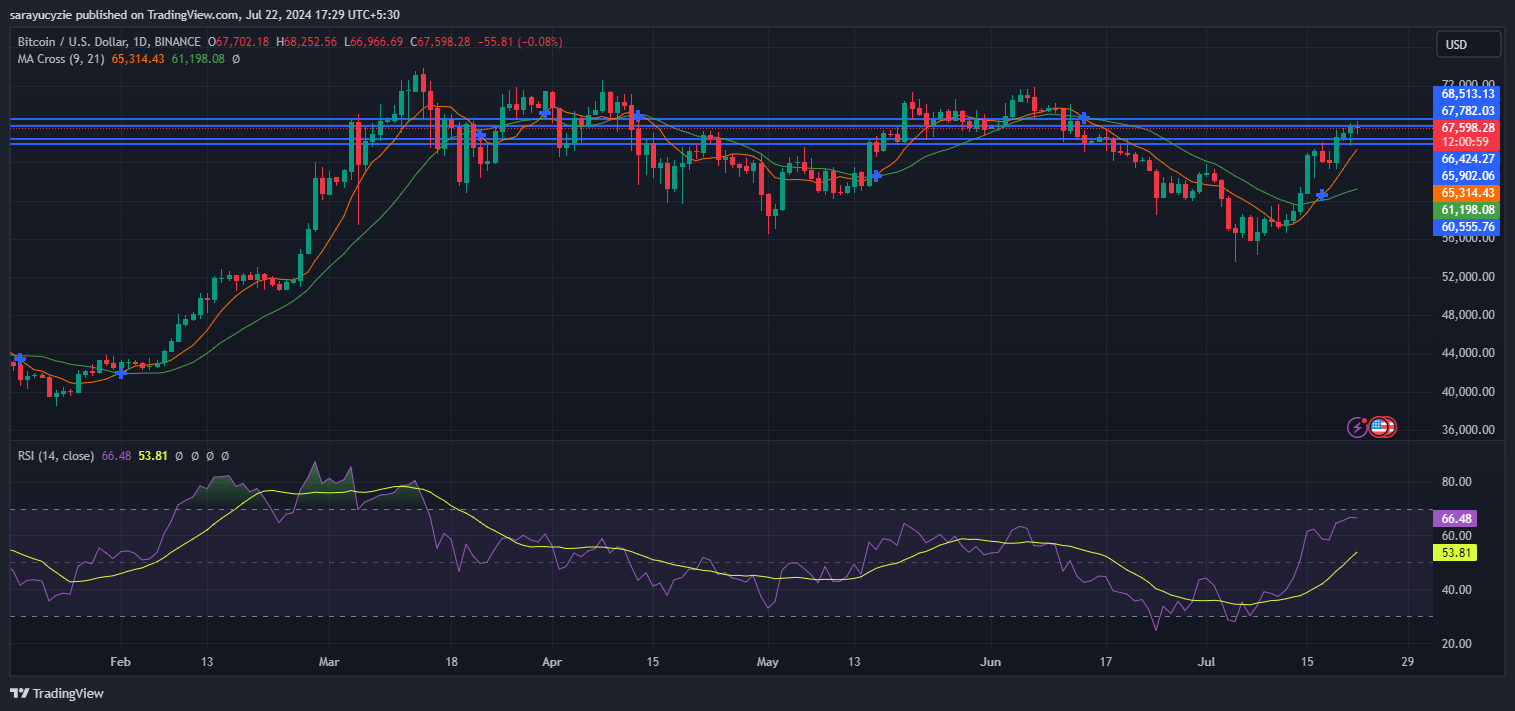
If the BTC price sustained in the bullish momentum, the initial resistance will be $67,782. The next subsequent resistance may be found at $68,513. On the other hand, if the bulls couldn’t break the initial resistance, the price might drop to a support level of $66,424. Furthermore, if bears overpowers, the price may drop and lead the price to the $65,905 range.
Highlighted Crypto News
HKX Withdraws Licensing Application in Hong Kong, Announces Closure