
- Bitcoin faces crucial levels; breaking $43,960 may lead to a $44,650 resistance test.
- BTC’s trading volume saw a decline of 15% in the past 24 hours.
As Bitcoin ETFs made a historic entry into the market last week, excitement turned into uncertainty as the leading cryptocurrency faced a bearish trend, currently trading at $42,789 with a slight 0.10% dip in the past 24 hours and a 6.56% decrease over the past week.
Meanwhile, in the first three days of trading, approximately 21,000 bitcoins, equivalent to $894 million at the current price of $42,600, flowed into the newly approved spot bitcoin exchange-traded funds. BlackRock‘s iShares Bitcoin Trust (IBIT) took the lead, adding 16,362 bitcoins, followed closely by Fidelity’s Wise Origin Bitcoin Fund (FBTC) with 12,112 bitcoins. However, Grayscale’s Bitcoin Trust (GBTC) experienced significant outflows, shedding around 25,000 BTC.
GBTC, once a closed-end fund, converted into an ETF alongside other new products as the U.S. Securities and Exchange Commission (SEC) gave its approval. The conversion brought about changes in fees and trading dynamics, causing GBTC holders to exit.
On the other side of the Bitcoin world, Jamie Dimon, CEO of JPMorgan Chase, offered what he claimed would be his last-ever criticism of Bitcoin. Dimon, while dismissing it as a “pet rock” that “does nothing,” acknowledged investors’ right to buy it in a free country. His comments coming a week after regulators approved BTC ETFs, marks a breakthrough for institutional investment in the cryptocurrency.
However, these updates do not stop the market from closely watching whether it can surpass the $50,000 mark this year and challenge its all-time high above $65,000.
Time For Bitcoin Bulls To Wake Up?
The daily chart shows a bearish trend, with the 9-day exponential moving average (EMA) currently positioned above the trading price at $43261. However, the daily relative strength index (RSI) suggests a neutral condition, standing at 47.
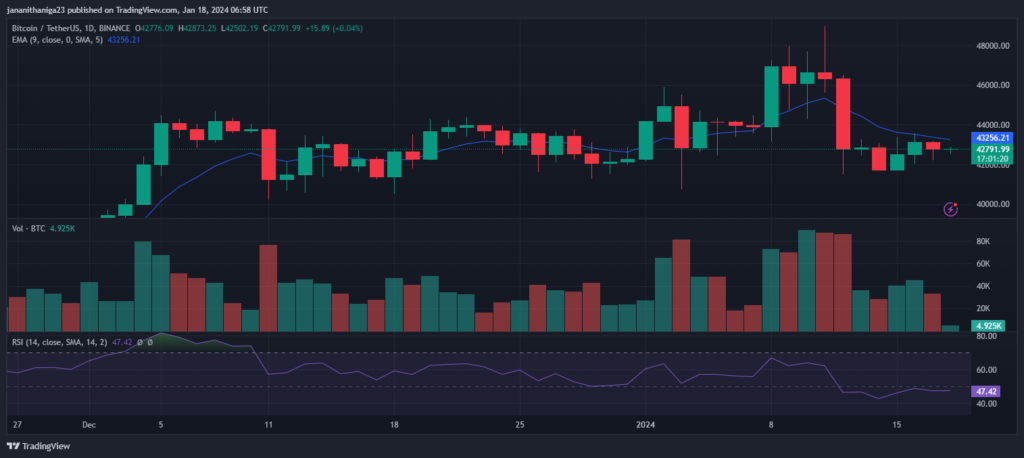
If the price manages to go above $43,960 then the price will likely climb further to test the $44,650 resistance level. However, if the price goes below the $41,710 level, then it will likely decline further to test the $41,380 support level.