- Bullish WAN price prediction is $0.99 to $1.64.
- The WAN price will also reach $2 soon.
- WAN bearish market price prediction for 2021 is $0.40.
In Wanchain (WAN) price prediction 2021, we use statistics, price patterns, RSI, RVOL, and much other information about WAN to analyze the future movement of the cryptocurrency.
Wanchain Current Market Status
According to coingecko, the price of WAN is $0.89 with a 24-hour trading volume of $37,936,239 at the time of writing. However, WAN has increased to 4.9% in the last 24 hours.
Moreover, WAN has a circulating supply of 192,680,162 WAN. Currently, WAN trades in cryptocurrency exchanges such as Binance, Mandala Exchange, Huobi Global, KuCoin, and ZT.
What is Wanchain (WAN)?
Wanchain is a public blockchain with support for creating smart deals using solidity. It also supports ring signature based private transactions and decentralized cross chain operation.
Wanchain has been developing its cross-chain infrastructure since 2017. In early 2021, it launched the world’s first decentralized direct BTC-ETH bridge. It also offers decentralized bridges connecting BTC, ETH, Ripple and EOS, as well as other chains such as Polkadot on the horizon. Wanchain’s various cross-chain bridges are all supported by integrated decentralized pools.
Wanchain (WAN) Price Prediction 2021
Wanchain holds the 379th position on CoinGecko right now. WAN price prediction 2021 explained below with a weekly time frame.
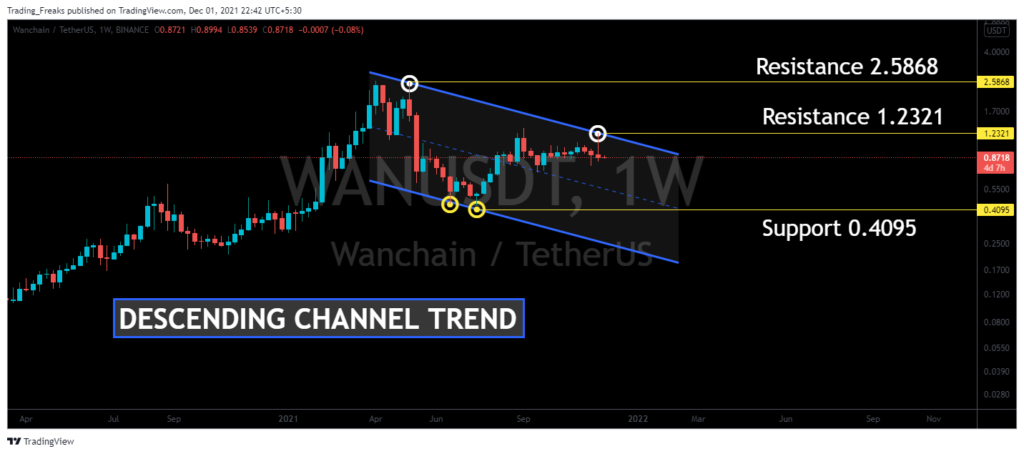
A descending channel is a pattern formed from two downward trend lines drawn above and below the price indicating the resistance and support levels. This pattern is also called channel down or falling channel. It is a bearish pattern defined by a trend line that supports a series of lower lows and a diagonal resistance level that connects low highs. While on the channel, prices are expected to rise from the upper and lower ranges. The method is very reliable because of such reverse changes.
Currently, WAN is at $0.89. If the pattern continues, the price of WAN might reach the resistance level to $1.2 and $2.5. If the trend reverses, then the price of WAN may fall to $0.4095.
Wanchain (WAN) Support and Resistance Level
The below chart shows the support and resistance level of WAN.
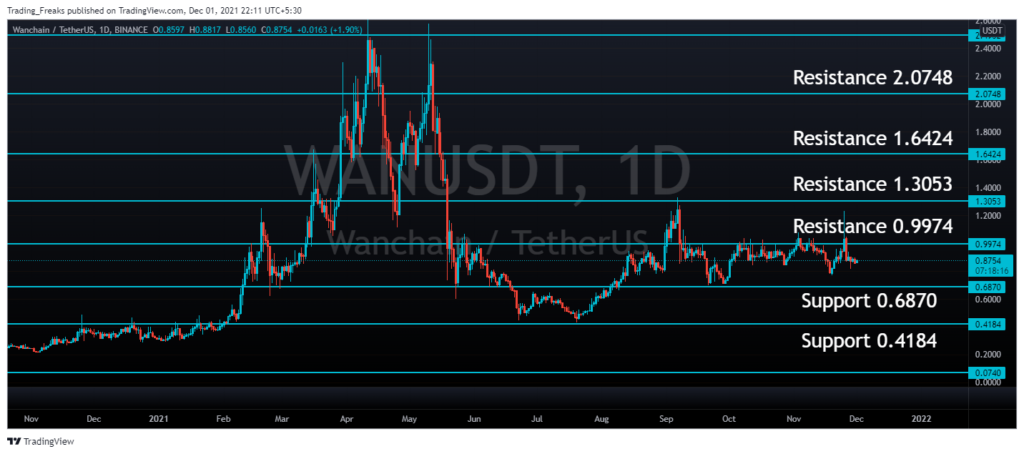
From the above daily time frame, it is clear the following are the resistance and support levels of WAN.
| Resistance Level 1 | $0.99 |
| Resistance Level 2 | $1.30 |
| Resistance Level 3 | $1.64 |
| Resistance Level 4 | $2.07 |
| Support Level 1 | $0.68 |
| Support Level 2 | $0.41 |
The charts show that WAN has performed a bullish trend over the past month. If this trend continues, WAN might run along with the bulls overtaking its resistance level at $2.07.
Accordingly, if the investors turn against the crypto, the price of the WAN might plummet to almost $0.41, a bearish signal.
Wanchain Price Prediction 2021 — RVOL, MA, and RSI
The Relative Volume (RVOL) of WAN is shown in the below chart. It is an indicator of how the current trading volume has changed over a period of time from the previous volume for traders. Currently, RVOL of WAN lies below the cutoff line, indicating weaker participants in the current trend.
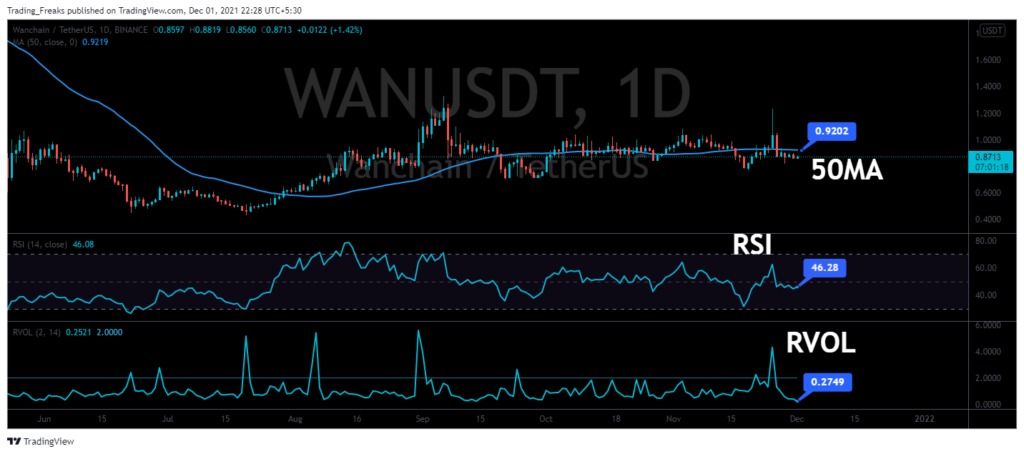
More so, the WAN’s Moving Average (MA) is shown in the chart above. Currently, WAN is in a bearish state. Notably, the WAN price lies below 50 MA (short-term), so it is completely in a downward trend. Therefore, there is a possibility of a reversal trend of WAN at any time.
Meanwhile, the relative strength index (RSI) of the WAN is at level 46.28. This means that WAN is in a nearly oversold state. However, this gives confidence for the traders to trade without any fear.
Wanchain Price Prediction 2021 — ADX, RVI
Let us now look at Wanchain’s Average Directional Index (ADX). It helps to measure the overall strength of the trend. The indicator is the average of the expanding price range values. This system attempts to measure the strength of price movement in the positive and negative directions using DMI indicators with ADX.

The above chart represents the ADX of Wanchain. Currently, WAN lies in the range at 24.78, so it indicates a weak trend.
From the above chart, the Relative Volatility Index (RVI) of WAN. RVI measures the constant deviation of price changes over a period of time rather than price changes. The RVI of WAN lies above the 50 level, indicating that the direction of volatility is high. In fact, WAN’s RSI is at the 46.28 level thus confirming a potential either buy or sell signal.
Comparison of WAN with BTC, ETH
The below chart shows the price comparison between Bitcoin, Ethereum, and Wanchain.
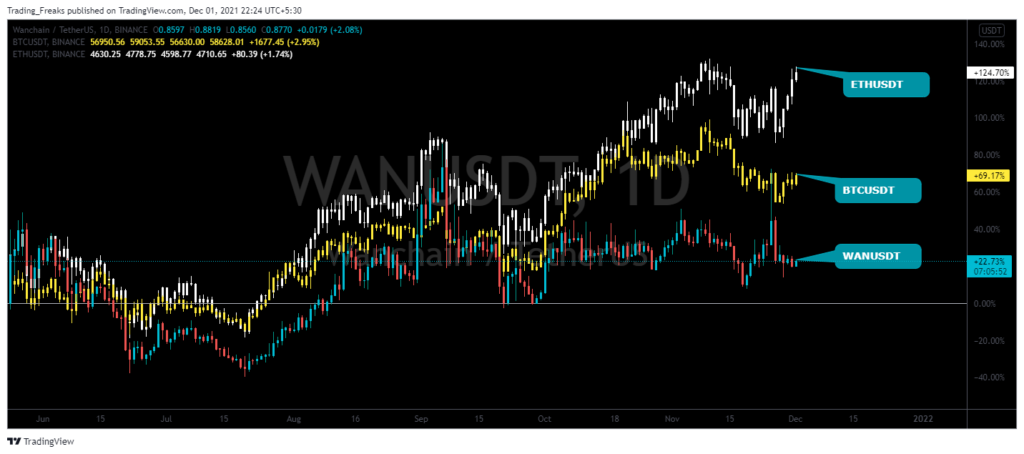
From the above chart, we can identify the trend of the ETH, BTC and WAN is moving at the same level as the trend. This indicates that when the price of BTC increases or decreases, the price of ETH and WAN also increases or decreases respectively.
Conclusion
With continuous improvements in the Wanchain network, we can say that 2021 is a good year for WAN. For this reason, the bullish price prediction of Wanchain in 2021 is $1.6. On the other hand, the bearish WAN price prediction for 2021 is $0.4.
Furthermore, with the advancements and upgrades on the WAN ecosystem, the performance of WAN would rise reaching $1.2 very soon. But, it might also reach $2 if the investors believe that WAN is a good investment in 2021.
Wanchain is a distributed ledger that enables cross-chain transactions and interoperability of multiple chains.
WAN has listed on many crypto exchanges which include Binance, Mandala Exchange, Huobi Global, KuCoin, and ZT.
With the ongoing developments and upgrades within the WAN platform, it has a high possibility of reaching its ATH soon.
On May 04, 2018, WAN reached its new all-time high (ATH) of $9.84.
Wanchain (WAN) seems to be one of the top-gaining cryptocurrencies this year. According to the recorded achievements of WAN in the past few months, WAN is considered a good investment in 2021.
Wanchain (WAN) is one of the active crypto that continues to maintain its Bullish state. Eventually, if this bullish trend continues then Wanchain (WAN) will hit $2 soon.
Wanchain (WAN) price is expected to reach $1.5 by 2022.
Wanchain (WAN) price is expected to reach $3 by 2023.
Wanchain (WAN) price is expected to reach $6 by 2024.
Wanchain (WAN) price is expected to reach $10 by 2025.
Recommended for You