
- Virtuals Protocol price surges 225% in 30 days with growing social engagement.
- Technical analysis shows mixed signals; $2.10 resistance and $1.86 support are key.
Virtuals Protocol (VIRTUAL) is trading at $1.89, marking a 12.08% rise in the last 24 hours. The token holds a market capitalization of $1.23 billion, with a daily trading volume reaching $535.26 million, up by 223.80% during the same period. Over the past day, VIRTUAL’s price fluctuated between $1.70 and $2.09. The project has a total token supply capped at 1 billion, with approximately 652.62 million tokens circulating in the market.
Growing Social Interest Boosts Virtuals Protocol and Arbus Token
LunarCrush reports that Virtuals Protocol has seen its price rise by an impressive 225.86% over the past month. The increase in activity follows an uptick in social media interactions. Many more people are mentioning and engaging with the project, which underlines the growing interest from the community. The engagements now exceed 10 million and the social mentions are almost at 12,000. There are now more individuals sharing about Virtuals Protocol, leading to more attention and popularity online.
🔥This is what firing on all cylinders looks like.
— LunarCrush.com Social Data (@LunarCrush) May 19, 2025
Virtuals Protocol price is up +225.86% over the last 30 days with both social mentions and engagements accelerating at a rapid pace.
👉What do you think? Will @virtuals_io continue to see acceleration? pic.twitter.com/DH9RHVTRaj
The Arbus Token has been recently introduced and is now ready for trading. Investors can trade ARBUS on Uniswap and Virtuals Protocol using the $ARBUS/$VIRTUAL pair. The collaboration with Virtuals Protocol aims to enhance token discoverability and provide deeper market analysis. This integration is expected to improve the overall trading experience for users within the Arbus community.
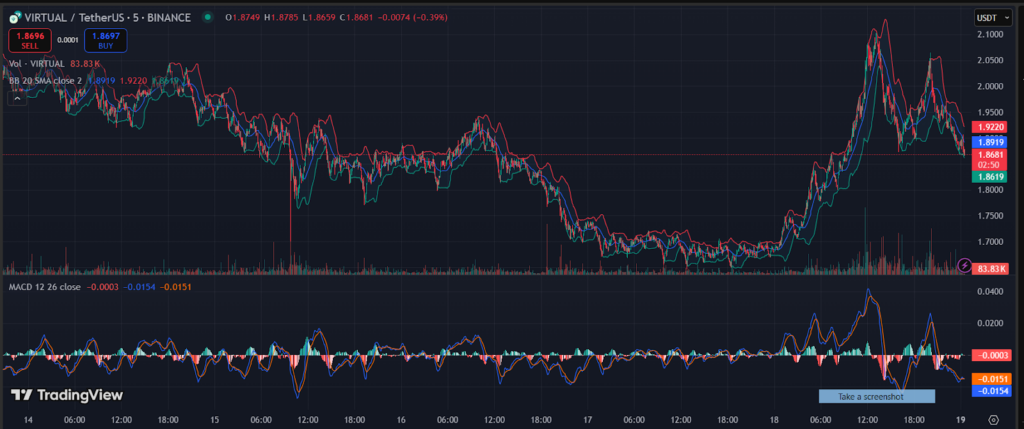
VIRTUAL Eyes $2.10 Resistance Amid Mixed Technical Signals
The near-term trend of VIRTUAL seems both favorable and unfavorable based on the charts. At $1.88, the price trends close to the average, and Bollinger Bands show some volatility developing. Based on these numbers, the price stands close to a support level, as the upper band is at $1.92 and the lower band is around $1.86. Recent trading activity shows a pullback from a high close of $2.10, reflecting some selling pressure after an upward trend.
The MACD indicator shows weakening bullish momentum as the MACD line sits just below the signal line, hovering near the zero mark. This crossover indicates a short-term bearish sentiment; however, the small histogram bars suggest potential stabilization or a range-bound trend. Key support levels to watch include $1.86 and $1.82, while resistance may be encountered near $1.92 and $2.10. Should buyers regain strength, a move toward $2.10 is a likely next target.If support falls through, the token might keep declining and even drop as low as $1.80.
Highlighted Crypto News for Today