In Venus (XVS) Technical Analysis 2021, we use past statistics, price analysis, RSI, MA, and much other information about XVS to analyze the future trend of the cryptocurrency.
Venus is an algorithmic money market and synthetic stablecoin protocol, specifically introduced on the Binance Smart Chain (BSC). The protocol is an easy-to-use solution for borrowing and lending crypto assets in the Decentralized Finance (DeFi) ecosystem, allowing users to borrow directly with collateral for high-speed lending, with fewer transaction costs.
Venus (XVS) Current Market Status
According to CoinGecko, the XVS price is trading at $31.61 with a 24-hour trading volume of $52,653,236, at the time of writing. However, XVS has increased by 3.7% in the last 24 hours.
In addition, XVS has a circulating supply of 10,586,434 XVS coins. Currently, XVS trades in Binance, Tokocrypto, CoinTiger, Hotcoin Global, and HitBTC.
Venus (XVS) Technical Analysis 2021
Venus (XVS) holds the 158th position on CoinGecko right now. The recent development and upgrades might push XVS to reach new heights. Now, let’s deep dive into the XVS technical analysis 2021. The daily time frame chart of Venus (XVS) is shown below.

An inverse head and shoulders pattern is similar to the standard head and shoulders pattern, but inverted: the head and shoulders top is used to predict reversals in downtrends.
The inverse head and shoulders pattern begins with a downtrend. This is the long-term decline that will eventually lead to exhaustion and a reversal higher as sellers exit and buyers step up. Minor support, forming the first shoulder, meets the downtrend. As the market begins to rise, it hits strong resistance and the downtrend resumes.
The strong resistance level is called the neckline. After the market makes a lower low, it finds strong support, forming the pattern’s head. Once again, the market encounters resistance at the neckline, which forms the second shoulder.
Currently, XVS is trading at $30.9. After this, XVS may continue to fall or rise according to the direction of breakout. With this pattern, XVS might reach the resistance level at $76 soon. If the trend reverses, then the price of XVS may fall to $12.72.
Venus (XVS) RSI
The below chart shows the relative strength index (RSI) of XVS.

As shown in the above chart, RSI remains at 65.07. This shows that XVS’s price is in a nearly overbought state. This shows that traders have to trade carefully, however, major price reversal could take place.
Venus (XVS) RVOL
The below chart shows the Relative Volume of XVS. It is an indicator that indicates to traders how the current trading volume has changed over a period of time compared to the previous trading volume.

Currently, the RVOL of XVS lies below the cutoff line which represents the weaker participants in the current trend.
Venus (XVS) Moving Average
XVS’s Moving Average (MA) is shown in the chart below. MA supports traders to find trends.

Currently, XVS is in a bullish state. However, XVS price is above 50 MA (short-term), and it has a high chance of moving higher. Furthermore, the XVS price is above 50 MA and 200 MA (long-term), so it is completely in a bullish state. Moreover, there is also a possibility of Trend reversal at any time.
Venus (XVS) Price Comparison With Bitcoin
The below chart shows the price comparison between XVS and BTC.
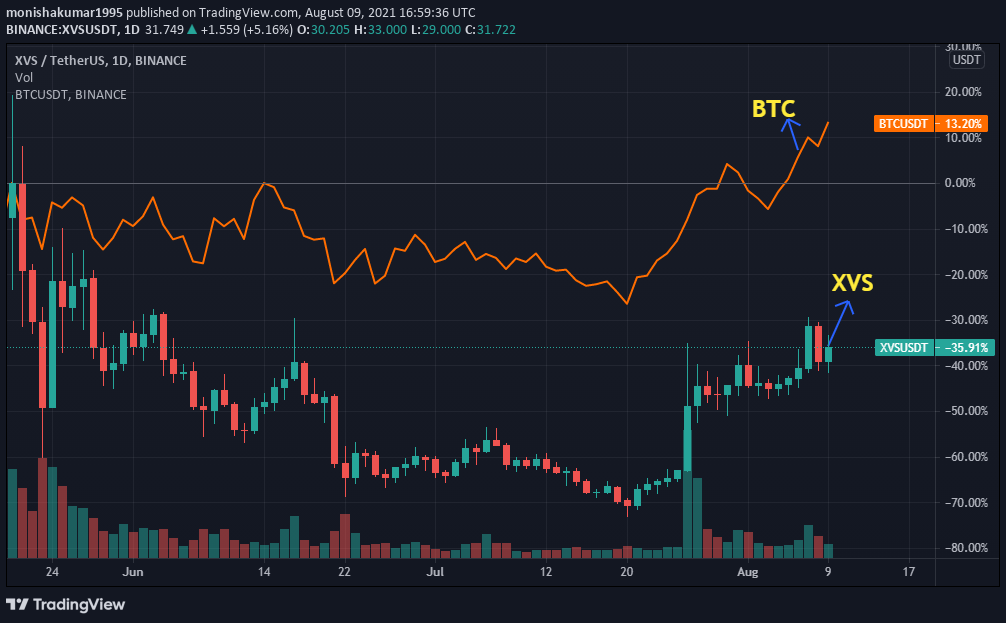
From the chart, we can identify the trend of the BTC and XVS is moving at the same level as the trend. This indicates when the price of BTC increases or decreases, the price of XVS also increases or decreases respectively.
Conclusion
With the ongoing developments and upgrades that are taking place within the XVS platform. Venus has a great future ahead in this crypto market. However, XVS can reach new heights.
Bullish XVS price prediction 2021 is $38.5. As mentioned above, it may reach great heights, however reaching $76 is also possible, if investors have decided that XVS is a good investment in 2021.
FAQ
XVS is the governance token for Venus Protocol. The Venus Protocol is a stablecoin and money market protocol that provides support for the Binance Smart Chain. This protocol is a fork of Compound and MarkerDAO.
XVS is listed on many cryptocurrency exchanges that include Binance, Tokocrypto, CoinTiger, Hotcoin Global, and HitBTC.
With the ongoing developments and upgrades within the XVS platform, it has the high possibility of reaching its ATH soon.
Disclaimer: The opinion expressed in this chart solely author’s. It is not interpreted as investment advice. TheNewsCrypto team encourages all to do their own research before investing.
Recommended for You